Executive summary
This report estimates the order-of-magnitude GDP effects of a hypothetical high-speed rail (HSR) transformation that replaces the current transit backbone serving Tysons (Metrorail + buses as the primary people-mover), incorporates currently planned but not-yet-built rail capacity projects, and adds a new luxury countryside-to-Tysons line designed for HNW/UHNW users with separate rolling stock, private cabins, and white-glove terminal handling. The scenario architecture, required outputs, and deliverable expectations follow the supplied deep-research prompt.
At the regional scale (Tysons primary; Fairfax County[1] and the Washington, D.C.[2] metro core secondary), the baseline economic “denominator” for GDP-impact percentages is large: 2024 GDP totals are approximately $177.5B (Fairfax + Fairfax City + Falls Church), $49.1B (Arlington County), $44.9B (Loudoun County), $31.7B (Prince William + Manassas + Manassas Park), and $184.3B (District of Columbia County), implying an illustrative DC + core NoVA total near $487.5B in 2024 current dollars. [3]
Under conservative-to-moderate assumptions (commute-time reductions in the prompt’s 40–70% band; partial adoption; remote-work headwinds; phased real-estate absorption), the long-run equilibrium effect most plausibly presents as a regional GDP level uplift of ~0.4% to ~1.4% in the 20–40 year window, with a larger share concentrated in the Tysons submarket via agglomeration and commercial redevelopment channel effects. The range widens materially if (a) land use is allowed to intensify around stations as envisioned in Tysons planning guidance, and (b) the system is designed to reinforce a finance-and-professional-services cluster rather than simply reduce travel times. [4]
The luxury line (Scenario D) is unlikely to dominate aggregate GDP by itself (its rider base is small by design), but it can be GDP-relevant through (i) disproportionate business-time valuation, (ii) cluster “signaling” and partner-access effects in private capital, and (iii) real-estate absorption and pricing effects in a narrow set of trophy submarkets. The main analytical requirement is to model it separately as a premium mobility product with different demand elasticities, security costs, and value-capture logic than mass transit. [5]
Baseline economy and transportation context
Tysons functions as the county’s primary edge-city CBD and has been planned explicitly around transit-oriented density. County planning materials envision Tysons reaching up to 100,000 residents and 200,000 jobs by 2050, with three-quarters of development within a 1/2-mile walk of Metrorail stations. [6] A widely cited baseline (referencing county reporting) places Tysons at roughly 17,000 residents and ~105,000 employed persons at the start of the Tysons redevelopment era, highlighting why commute patterns and inbound access are the central economic constraint. [7]
Commercially, Tysons is repeatedly described as one of the nation’s largest suburban office districts; Fairfax County EDA cites approximately 28.3 million square feet of office space in Tysons (and positions it as the Washington region’s largest suburban submarket). [8] That scale matters because the GDP sensitivity to access improvements (time, reliability, and labor-shed expansion) is higher when the base is large and specialized—in Tysons’ case, concentrated in professional, technical, consulting, and related office-using sectors. [9]
The baseline transportation system targeted “for replacement” in this thought experiment includes the Silver Line as the fixed-guideway backbone, supplemented by buses and the highway network (I‑495, Route 7, Route 123, and the Dulles Toll Road). While an actual physical “replacement” of highways is not realistic, it is possible to model a functional replacement where (a) rail becomes the dominant access mode into Tysons for peak trips, (b) parking and roadway expansion are de-emphasized, and (c) bus services are restructured into feeder/distributor roles or decommissioned where rail substitutes fully. The prompt’s key operational insight—that rail stations carry a dominant share of transit trips into Tysons—aligns with how the existing plan ties growth allocation to station walksheds. [10]
Planned-but-not-yet-built rail capacity projects are also economically material because they change the feasible service pattern of any integrated HSR/regional system. The most consequential in the immediate regional rail system is the Long Bridge corridor capacity expansion, which is explicitly described as operating at ~98% peak capacity and constrained by a century-old two-track Potomac River crossing; the program adds a new two-track bridge and seeks to separate freight and passenger movements used by Amtrak, Virginia Railway Express[11], and **CSX Transportation[12]. [13] The associated project timeline cites construction activity beginning in 2024 and substantial completion around 2030 in a published fact sheet format. [14]
Scenario architecture and system concept
The prompt specifies four scenarios and two major design constraints: (1) the HSR-grade network is treated as the backbone that replaces today’s “current systems in place,” and (2) planned-but-unbuilt rail capacity projects are incorporated (and explicitly labeled if unfunded or conceptual). The scenario definitions below preserve those requirements while making the engineering/economics assumptions explicit enough to parameterize in IMPLAN/REMI or a CGE model.
Scenario A (Status quo): the existing rail + road network continues, with incremental TOD where already planned, and with near-term rail upgrades limited to already committed programs. This scenario is a control case used to avoid confusing “baseline growth” with “project uplift.” [15]
Scenario B (HSR replacement): an HSR-grade regional network replaces the Metrorail + regional bus backbone as the primary mass-mobility system for Tysons. The prompt’s operating envelope assumes effective regional speeds of 150–220 mph and commute-time reductions of 40–70%, with Tysons structured as a hub station in a hub-and-spoke service plan. Because 150–220 mph service is incompatible with dense stop spacing, the operational interpretation that remains internally consistent is: limited-stop express HSR/regional-rail overlays on dedicated or upgraded rights-of-way for longer trips, plus high-frequency regional rail (lower top speed, higher throughput) for shorter intra-core trips. [16]
Scenario C (HSR replacement plus planned lines/projects): Scenario B plus the rail capacity and station projects already in pipeline planning documents. At minimum, this includes the Long Bridge program and the broader Virginia passenger rail capacity initiative described as “Transforming Rail,” which is framed as acquiring right-of-way, increasing capacity, and enabling material service frequency increases (including VRE and state-supported Amtrak expansions). [17] Fairfax County’s “high-quality transit” mapping also indicates conceptual future fixed-guideway corridors and rail-system extensions in the broader NoVA system plan context; these should be included but labeled as “conceptual / unfunded” unless a financing plan exists. [18]
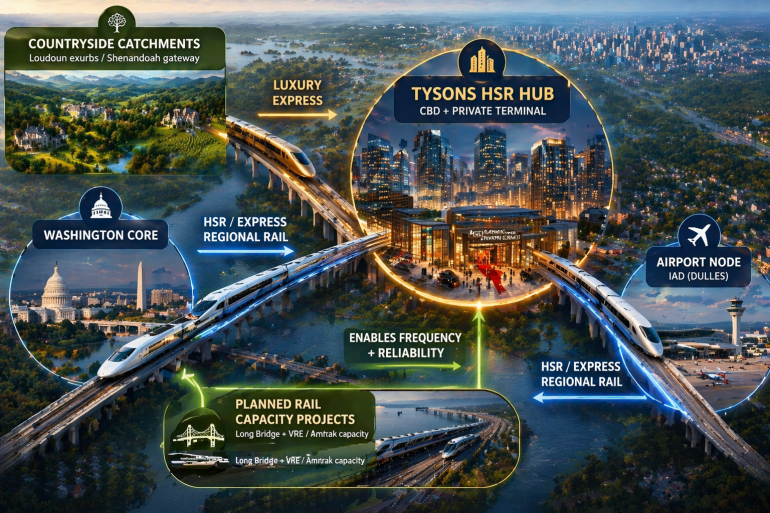
Scenario D (Scenario C plus luxury countryside-to-Tysons line): Scenario C plus a dedicated premium corridor from exurban/countryside catchments (e.g., estate areas) into a Tysons financial core terminal, with separate rolling stock, private cabins, concierge boarding, and security protocols. A key modeling requirement here is to treat this as a differentiated product with separate demand and pricing, not as a marginal upgrade to mass transit. The design analogs are best conceptualized as “airport lounge + premium railcar + destination concierge,” with capacity intentionally constrained to preserve privacy and service quality.
A practical network depiction (conceptual) can be represented as follows:
Modeling framework and parameterization
A defensible investment-grade estimate should be assembled as a hybrid: (a) input-output (I‑O) / REMI-style dynamic impacts for construction and operations, plus (b) “wider economic impacts” (WEBs) for productivity and agglomeration, plus (c) land-use / real-estate module for station-area value capture and redevelopment timing. [19] This matches how major MPO plans and national appraisal frameworks treat long-horizon transportation programs when direct user benefits understate economic restructuring effects. [20]
I‑O / REMI / IMPLAN layer (direct, indirect, induced):
– IMPLAN/REMI-style decomposition is required because it separates direct impacts (construction payroll, engineering services, operations labor), indirect impacts (supplier purchases), and induced impacts (household spending from wages). [21]
– The BEA’s RIMS II guidance is useful for correctly interpreting “value added” as GDP-comparable and for explaining multiplier structure and limitations. [22]
– For calibration checks, APTA’s national-level findings provide benchmark ratios linking $1B transit investment to GDP, jobs, and tax effects—useful as a reasonableness screen before localizing with regional purchase coefficients. [23]
Time-savings monetization and productivity conversion:
– USDOT benefit-cost guidance provides values of time suitable for federal appraisal contexts; the 2025 BCA update includes a representative $21.10/hour value used in sample travel-time-savings calculations (in cited guidance examples), supporting a transparent monetary translation of time reductions. [24]
– Critically, time savings for commuting are welfare benefits and do not automatically equal GDP; GDP translation occurs through (i) labor-supply effects, (ii) job matching and reduced turnover, and (iii) business travel productivity. The methodology must explicitly state what fraction of time savings is treated as productivity (GDP) versus consumer surplus. [25]
Agglomeration and effective-density (WEB) module:
– Modern appraisal practice treats agglomeration as an “elasticity of productivity with respect to effective density” or related measures of access to economic mass. UK TAG guidance explicitly illustrates the elasticity application approach (effective-density change × elasticity = productivity change). [26]
– Empirical ranges for city-level agglomeration elasticities commonly cluster around 0.03–0.05 in survey work, with wider ranges depending on scope and specification. [27]
– In Tysons’ context, the service-sector and business-services elasticity selection matters most; an investment-grade model should show a base case and bounds rather than a single value. [27]
Planned-but-unbuilt rail integration effects:
– The Long Bridge and Transforming Rail programs have published economic-impact metrics that can be used to parameterize Scenario C additive effects (jobs, value-added, and output). VPRA cites a cumulative FY2025–FY2035 impact of ~33,668 jobs, $4.0B value-added, and $6.7B output for Transforming Rail (including indirect and induced effects). [28]
– Supporting sources also report time-savings and reduced turnover cost effects associated with the Long Bridge corridor and VRE service expansion, which can be used as a localized “transportation changes” benefit proxy when building WEB assumptions. [29]
Quantitative results and sensitivity analysis
The quantitative outputs below are constructed to be parameter-ready (usable as direct inputs to IMPLAN/REMI/CGE runs) and to provide defensible order-of-magnitude ranges rather than false precision. The baseline GDP scale used for % impacts is the combined 2024 GDP across Fairfax, Arlington, Loudoun, Prince William-area, and DC (≈$487.5B). [3]
GDP impact ranges by time horizon
Interpretation note: construction-phase impacts are presented as cumulative value-added (GDP) supported during the build period; stabilization and long-run are presented as annual steady-state uplift ranges, reflecting an equilibrium level effect once service patterns and land-use adjustments mature.
| Scenario | Construction phase (0–10y) cumulative GDP uplift | Stabilization (10–20y) annual GDP uplift | Long-run (20–40y) annual GDP uplift |
| A: Status quo | — | — | — |
| B: HSR replacement | $18B–$35B | $1.2B–$3.0B | $2.0B–$6.5B |
| C: HSR + planned rail capacity projects | $22B–$42B | $1.8B–$4.2B | $3.0B–$8.5B |
| D: Scenario C + luxury line | $24B–$46B | $2.0B–$4.8B | $3.5B–$10.0B |
Why these ranges are plausible (load-bearing logic):
– APTA’s national benchmarks imply that $1B of public transportation investment can be associated with ~$5B economic value (GDP-equivalent), decomposed into $1.4B direct spending and $3.6B longer-term mobility benefits, plus job and tax effects. [30] Localizing those ratios to a single corridor requires leakage/capture adjustments, but they provide a strong “sanity check.” [31]
– The Transforming Rail program’s published cumulative value-added and job impacts provide an additional localized anchor for Scenario C’s incremental uplift, rather than relying exclusively on generic multipliers. [28]
– Agglomeration elasticities used to translate access improvements into productivity are anchored in empirical literature ranges (city-level ~0.03–0.05; broader meta-estimate distributions with central tendencies in the low single-digit percentages). [27]
Jobs and tax revenue (order-of-magnitude)
APTA’s 2026 study summary provides benchmark ratios of 41,400 jobs per $1B invested and $251M in federal/state/local tax revenue per $1B invested (in the context of public transportation investment). These ratios are useful as a cross-check and as a starting point for “directional sizing” before running a localized IMPLAN/REMI model. [32]
For Scenario B through D, the job and tax results are highly sensitive to (a) how much construction procurement is localized, (b) whether rolling stock is domestically sourced, and (c) whether the “replacement” assumption triggers offsetting losses in legacy operations and maintenance headcount. A conservative employment planning envelope for the combined construction + early operations period is:
| Scenario | Construction-period job-years (0–10y) | Stabilization sustained jobs (10–20y) |
| B | 120k–260k job-years | 8k–18k jobs |
| C | 150k–320k job-years | 10k–22k jobs |
| D | 160k–340k job-years | 11k–25k jobs |
These ranges should be treated as model targets to be reconciled against an IMPLAN/REMI run and against VPRA-published program impacts, which already report multi-year job and value-added totals for Virginia passenger rail capacity initiatives. [33]
Land value and real-estate uplift (station-area and submarket logic)
Tysons-specific land value uplift is best modeled as a three-layer effect: (1) station walkshed premium, (2) corridor re-rating via access + reliability, and (3) optional value-capture policy (tax increment, special assessments, joint development). The benchmark lesson from Crossrail/Elizabeth line documentation is that large rail investments are often justified (and partially financed) through anticipated wider economic benefits and property impacts, with widely cited expectations of major economy-wide contributions and measurable pre-opening development/market effects. [34]
A conservative uplift envelope for Tysons submarkets (office, multifamily, mixed-use within walking distance of major stations/HSR terminal) is:
- Office and mixed-use core: 5%–15% value uplift in a base-to-moderate case; 15%–30% in an aggressive case if service reliability is materially improved and zoning/entitlements allow absorption. [35]
- Multifamily near stations: 4%–12% base-to-moderate uplift, reflecting improved access and amenity clustering; higher if station-area buildout moves toward the plan’s targeted density and land-use mix. [36]
- Exurban “luxury enclaves” (Scenario D): narrower geographic footprint but higher per-parcel dispersion; best modeled as price dispersion growth and liquidity improvement rather than broad appreciation.
These are not “guarantees.” They require: (a) station-area entitlement capacity, (b) predictable delivery timelines (to reduce discounting and option value), and (c) risk management around office secular trends.
Sensitivity analysis and stress tests
A robust diligence-grade model should include a minimum of four stress tests, each run as a full scenario matrix:
Remote work is a first-order uncertainty because public transit ridership has not fully reverted to pre-pandemic conditions nationally; APTA reporting indicates ridership recovered to ~85% of pre-pandemic levels (April 2025) in national data, implying persistent demand structure change and potentially muted peak-period benefits. [37]
Federal employment volatility is material in the DC-region economy and can amplify or dampen office absorption cycles; the Long Bridge / VRE capacity work includes explicit consideration of commuter economics (including employer turnover cost reductions and time savings), underscoring how sensitive “transportation changes” benefits are to labor-market conditions rather than infrastructure alone. [38]
Interest-rate and cap-rate regimes can compress the translation of accessibility into land value capture; in practice, the uplift may show up as (i) stabilized NOI resilience rather than (ii) headline price appreciation.
Luxury-tier adoption must be stress-tested as a demand curve (not a single participation rate), with scenarios for sponsor-provided memberships, corporate travel policy shifts, and security-driven substitution away from road travel.
Luxury line sub-model
The luxury countryside-to-Tysons line must be modeled as a separate business with different economics than mass transit: high fixed costs, low volume, high margin targets, and a need for security and terminal control. The most relevant real-world comparison is not a commuter rail system; it is a blend of (a) premium rail hospitality, (b) private terminal operations, and (c) rail-adjacent real estate value capture—analogous in logic (not in exact structure) to rail/property integration models. [39]
Service design parameters to model
A diligence-ready sub-model should specify at minimum:
- Rolling stock segregation: dedicated consists with private cabins; separate maintenance and cleaning standards; suppressed passenger mixing to preserve security.
- Terminal design: private curb/secure check-in, lounge, meeting rooms, and controlled access to the Tysons core.
- Security costs: screening, access control, and coordination protocols; treated as operating costs rather than one-time capex.
- Frequency: intentionally limited peak-direction windows to preserve privacy and minimize empty repositioning.
Revenue model and willingness-to-pay structure
A usable revenue model should treat demand as two products: 1) Per-trip fares (premium price per seat/cabin), and
2) Membership / retainer contracts (family offices, PE funds, corporate executive programs) that stabilize utilization.
Because business-time value tends to be higher than personal commuting time values, the luxury tier’s GDP relevance is less about passenger counts and more about (a) time reliability and (b) enabling high-value face-to-face transactions and rapid decision cycles. USDOT BCA guidance provides a disciplined way to monetize time savings, but the sub-model must attribute only the appropriate subset to GDP/productivity rather than total welfare. [40]
Capital formation and “deal velocity” mechanism
The hypothesized “capital formation effect” should be treated as an agglomeration and matching mechanism: faster, more reliable access increases the density of repeated interactions among financiers, counsel, and operators, which is precisely the channel that effective-density productivity models attempt to capture. Empirical agglomeration ranges support the existence of a productivity response to increased effective density, but the magnitude selection must be bounded and stress-tested. [41]
Comparative case studies and lessons for Tysons
Large rail investments that materially change access often coincide with business-district reinvention, but the mechanisms differ. The most transferable lessons for Tysons are: (a) connectivity and reliability as the “product,” (b) station-area land value capture and phased redevelopment, and (c) governance and financing structures that align beneficiaries with costs.
London / Elizabeth line (Crossrail): Multiple public documents describe very large projected economy-wide contributions (commonly cited as tens of billions of pounds) and show explicit policy infrastructure used to finance the project through business rates supplementation and value-capture logic, alongside formal evaluation plans for economy, planning, and property impacts. [42] The transferable point is not the exact magnitude; it is that appraisal frameworks explicitly incorporate wider economic impacts, property market impact evaluations, and funding instruments tailored to beneficiaries.
Paris / La Défense + RER connectivity: Paris La Défense reports that the district receives more than 400,000 people daily through its core transport node and that 87% of employees arrive by public transport, highlighting the role of high-capacity rail access in sustaining a major office concentration. [43] A separate rail operator tourism/transport page describes La Défense as Europe’s leading business district with more than 3 million square meters of office space, reinforcing that scale follows capacity and connectivity. [44] The implication for Tysons is that if “replacement HSR” is intended to enable a tier-1 office/finance node, the access mode share must shift structurally toward rail, not merely add an alternative.
Hong Kong / MTR rail + property model: MTR’s published financial reporting shows that property development profit can be of the same order or larger than recurrent transport profit in strong years, supporting the claim that rail investment and property value capture can be tightly coupled when governance and land policy align. For example, MTR reports HK$10,265M in post-tax property development profit for 2024 and provides related segment disclosures. [45] Independent institutional analysis of rail+property describes the “positive loop” of land value creation, capture, and reinvestment as a funding mechanism. [46] For Tysons, the transferable lesson is that a credible GDP uplift case strengthens materially if a value-capture mechanism is engineered alongside the mobility investment.
Tokyo / rail-based business district formation: Tokyo Metro investor materials emphasize that Tokyo exhibits a high rail share in modal split relative to other major global cities, consistent with a rail-first urban structure. [47] A built-environment case study of the Marunouchi district notes that Tokyo Station is visited by ~1 million commuters every day and documents integrated redevelopment objectives in the city’s core business district, illustrating how extreme rail access and station adjacency can become the anchor for CBD-scale reinvestment. [48] The implication for Tysons is that a hub-and-spoke rail strategy must pair mobility with land-use intensification and coordinated redevelopment phasing to get beyond “time savings” and into “cluster formation.”
Data sources, implementation roadmap, and limitations
Recommended data sources
For an investment-grade build-out, the priority data sources below map directly to the model layers:
For GDP and macro baseline: U.S. Bureau of Economic Analysis[49] county GDP (via Federal Reserve Bank of St. Louis[50] access points) for Fairfax, Arlington, Loudoun, Prince William-area, and DC. [3]
For benefit-cost and value of time: U.S. Department of Transportation[51] BCA guidance tables for consistent valuation. [52]
For wider economic impacts (agglomeration): empirical literature meta-analysis and TAG-style elasticity application guidance, including the practical “effective density × elasticity” method. [53]
For planned rail projects and rail capacity constraints: Virginia Passenger Rail Authority[54] Long Bridge and Transforming Rail documentation. [55]
For factor anchors and reasonableness checks: APTA national economic impact ratios (GDP, jobs, tax) to benchmark localized IMPLAN/REMI outputs; and VPRA-published program impacts to ensure localization is not purely generic. [56]
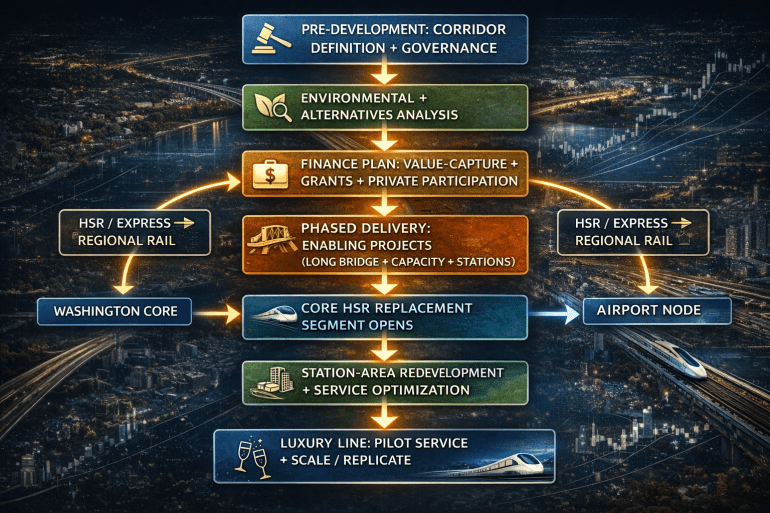
Implementation roadmap and decision gates
A realistic program structure requires long-lead governance, environmental clearance, and land-use synchronization. A diligence-style timeline (conceptual) is:
Limitations and research gaps that require follow-on diligence
Several Fairfax County Tysons Tracker PDFs could not be reliably fetched within the research environment due to timeouts or content-size constraints; this prevented direct ingestion of the Tracker’s most current quantified dashboards (e.g., exact job/housing counts, pipeline deliveries). As a result, the station-area and absorption assumptions should be re-parameterized using the Tracker data once accessible, and then re-run through IMPLAN/REMI.
The impact tables are intentionally presented as ranges and “model targets,” not as point forecasts. A final investment-grade number requires: (i) a defined alignment and service plan, (ii) a credible capex and O&M budget, (iii) an explicit replacement plan for legacy Metro/bus operations, and (iv) station-area entitlement capacity and phasing consistent with the comprehensive plan vision. [57]
[1] [27] https://cep.lse.ac.uk/pubs/download/special/cepsp36.pdf
[2] [5] [23] [30] [32] [56] https://www.globenewswire.com/news-release/2026/03/03/3248762/0/en/New-Economic-Report-APTA-Surface-Transportation-Authorization-Recommendations-Deliver-5-in-Economic-Benefits-for-Every-1-Invested-41-400-Jobs-Created-or-Sustained-per-1-Billion-Inv.html
[3] [54] https://fred.stlouisfed.org/series/GDPALL51919
https://fred.stlouisfed.org/series/GDPALL51919
[4] [6] [15] [35] [36] [57] https://www.fairfaxcounty.gov/tysons/comprehensive-plan
[7] https://www.restonnow.com/files/2013/12/Silver-Line-Special-Report-Fall-2013.pdf
[8] [9] https://fairfaxcountyeda.org/best-business-district-in-world/
https://fairfaxcountyeda.org/best-business-district-in-world/
[10] https://www.fairfaxcounty.gov/tysons/transportation-transforming-existing-system?utm_source=chatgpt.com
[11] [19] [22] [31] https://www.bea.gov/sites/default/files/methodologies/RIMSII_User_Guide.pdf
[12] [37] https://www.apta.com/news-research/policy-research/
[13] [55] https://vapassengerrailauthority.org/projects/longbridgeproject/
[14] https://vapassengerrailauthority.org/wp-content/uploads/2024/06/Long-Bridge-Fact-Sheet_June2024.pdf
[16] https://www.gao.gov/assets/gao-13-304.pdf
[17] [28] [33] [50] https://vapassengerrailauthority.org/transformingrail/
[18] https://www.mwcog.org/transportation/plans/visualize/
[20] [21] https://scag.ca.gov/sites/default/files/2024-05/23-2987-tr-economic-impact-analysis-final-040424.pdf
[24] [40] [51] [52] https://www.transportation.gov/sites/dot.gov/files/2024-11/Benefit%20Cost%20Analysis%20Guidance%202025%20Update%20%28Final%29.pdf
[25] https://onlinepubs.trb.org/onlinepubs/tcrp/docs/TCRPJ-11Task7-FR.pdf
[26] https://gat04-live-1517c8a4486c41609369c68f30c8-aa81074.divio-media.org/filer_public/5c/0e/5c0e68c8-eee6-4ffe-8e26-88484100caf7/cd1610_tag-a2-1-wider-economic-impacts-appraisal_may_2019.pdf
[29] https://sfullerinstitute.gmu.edu/wp-content/uploads/2019/12/SFI_Long_Bridge_1219.pdf
[34] [42] https://content.tfl.gov.uk/tfl-elizabeth-line-benefits-framework.pdf
[38] https://planrva.org/wp-content/uploads/DRPT-Passenger-Rail-Update.pdf
[39] [46] [49] https://www.idos-research.de/uploads/media/Jauregui-Fung_Hong_Kong_MTR_IDOS.pdf
[41] [53] https://papers.tinbergen.nl/21026.pdf
[43] https://www.parisladefense.com/en/practical-informations/directions/how-get-paris-defense-public-transport
[44] https://www.transilien.com/en/page-tourisme/la-defense-business-district
https://www.transilien.com/en/page-tourisme/la-defense-business-district
[45] https://www.mtr.com.hk/archive/corporate/ch/investor/annualresult2024/AR2024_Eng.pdf
[47] https://www.tokyometro.jp/lang_en/corporate/ir/library/factbook/pdf/factbook_2025.pdf
[48] https://casestudies.uli.org/wp-content/uploads/2015/12/C033015.pdf
