1. Executive Summary
When a security checkpoint guard faces a fast-moving intruder sprinting towards a secure entrance, every fraction of a second counts. This report analyzes how much reaction time is available as an aggressive intruder covers short distances at world-class sprint speeds, comparing the performance of a human operator vs. an automated computer-vision and robotic barrier system. Using elite track-and-field records as a benchmark for human running speed, we calculate the time an intruder would take to reach a checkpoint from various distances. We then break down the human response chain (from noticing the threat to physically activating a barrier) and the automated system response chain (from sensor detection to mechanical barrier closure). By quantifying each step’s typical duration, we derive the safety margins – the time remaining (if any) after the barrier fully closes – for both human and automated responses.
Our analysis shows that an automated system can initiate and execute a barrier closure roughly 0.3–0.5 seconds faster than a human on average, a significant time savings in close-proximity security scenarios. At very short distances (e.g. 5–7 meters), human operators often have insufficient time to react; an automated system, with its quicker detection and actuation, can create a small but potentially life-saving time buffer. At moderate distances (around 15 meters), a human operator may only just manage to close a barrier in time with near-zero safety margin, whereas an automated system can still create a comfortable margin of roughly half a second. This “delta” in available response time – the automation benefit – represents the core advantage of augmenting or replacing human reactions with faster sensor-and-actuator systems.
However, the benefit of automation is not unconditional. If the mechanical barrier itself requires significant time to close (for example, heavy gates taking ~1 second or more to shut), much of the reaction-speed advantage can be negated. Furthermore, real-world factors like poor lighting, visual obstructions, or extreme weather can slow down sensor recognition, and a system prone to false positives (closing when it shouldn’t) or false negatives (failing to detect a real threat) could undermine the security benefit or introduce new safety hazards. We introduce the concept of a Jensen’s Alpha-style performance metric adapted from finance, to assess whether an automated checkpoint provides “excess” time-saving benefit (positive alpha) after accounting for the difficulty of operating conditions (analogous to risk). Our Jensen’s Alpha analysis suggests that under favorable conditions, an automated system can indeed produce a positive “time-saving alpha”, indicating it outperforms the expected baseline improvement. In more challenging scenarios (low visibility, high crowd density, etc.), the system’s effective “alpha” can shrink or even turn negative – meaning any theoretical speed advantage is eroded by environmental challenges or system latency.
Bottom line: At typical engagement distances in the 10–20 meter range, a well-implemented automated checkpoint meaningfully extends the response window, potentially preventing intrusions that might be unavoidable with human reaction time alone. The benefit is on the order of a few tenths of a second, which corresponds to several extra meters of stopping distance for a fast-moving threat. Nonetheless, careful attention to system reliability, sensor performance, and fail-safe design is crucial. Non-lethal automated barriers must be designed with safety overrides and rigorous testing to ensure that increased speed does not introduce unacceptable risks to authorized personnel or bystanders. In summary, automation can provide a measurable reaction-time advantage – and thus a higher likelihood of neutralizing fast-moving threats in time – but only if engineered and deployed with strong consideration of environmental conditions, failure modes, and safety constraints. Positive “alpha” (excess performance) is achievable, but not guaranteed, under real-world complexities.
Checkpoint reaction advantage
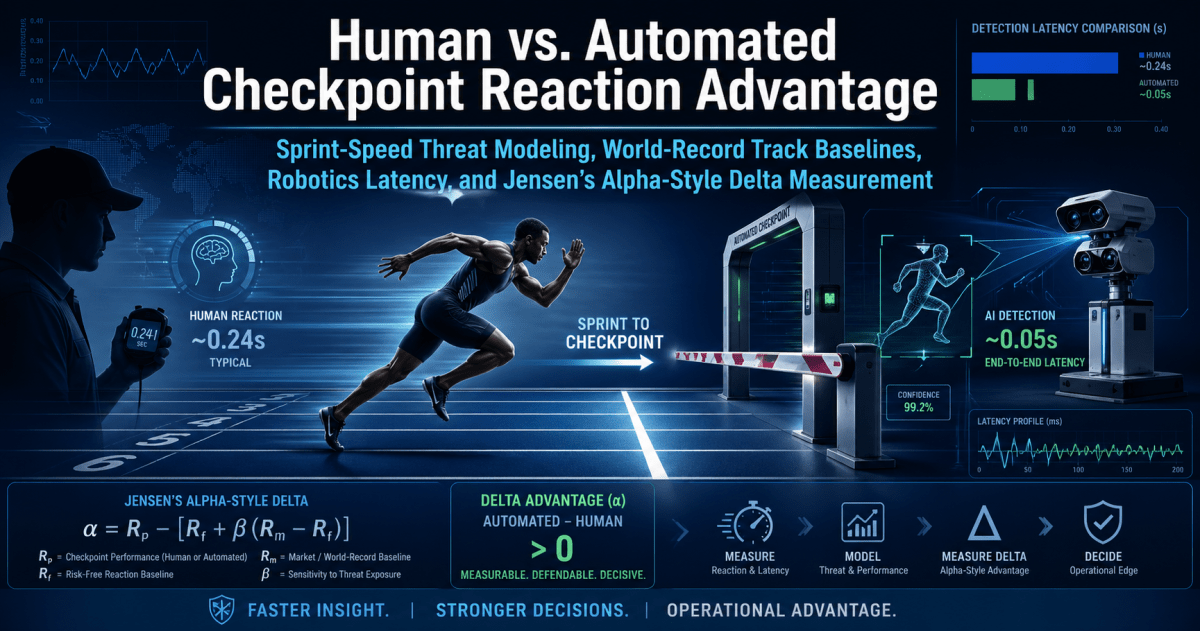
Human vs. Automated Checkpoint Reaction Advantage
Automation can create a reaction-time edge of roughly 0.3–0.5 seconds in close-range checkpoint scenarios, which can translate into several extra meters of stopping distance against a fast-moving threat.
10.44 m/s
World-record 100 m average speed baseline
0.3–0.5 s
Typical automation time advantage
10–15 m
Critical range where automation can matter most
2. Track-and-Field Speed Baselines
To establish conservative human speed benchmarks for a sprinting aggressor, we look at the fastest recorded sprint performances in track-and-field. We use two key reference points from World Athletics (formerly IAAF) records: the shortest standard sprint event (the indoor 60-meter dash) and the classic “fastest person in the world” event (the outdoor 100-meter dash). As of the latest official records, Christian Coleman holds the men’s indoor 60 m world record at 6.34 seconds (set in 2018), and Usain Bolt holds the men’s 100 m world record at 9.58 seconds (set in 2009). For context, World Athletics and the International Olympic Committee recognize a reaction time faster than 0.100 seconds as a false start, essentially treating 0.10 s as the minimum plausible human reaction to the starter’s gun. These record-setting sprint performances and reaction-time standards will serve as inputs to our threat timing model. [en.wikipedia.org] [guinnesswo…ecords.com] [en.wikipedia.org]
Table 1 below presents the two benchmark sprint records along with their calculated average speeds over the race distance. We include the average speed in meters per second (m/s), and convert it to kilometers per hour (km/h) and miles per hour (mph) for intuitive understanding. Notably, although the 100 m dash is longer, its record (Bolt’s 9.58 s run) entails a higher average speed than the 60 m record, because the 100 m race allows more time for the sprinter to accelerate to top speed. Indeed, Usain Bolt’s 100 m world record average speed was about 10.44 m/s (37.6 km/h), significantly faster than Christian Coleman’s 60 m record average of ~9.46 m/s (34.0 km/h). Bolt achieved an even higher peak speed during that 100 m run – approximately 27.8 mph (44.7 km/h) at around the 60–80 m mark. These figures represent the upper extremes of human running capability on flat ground.
Table 1: Sprint Baseline Speed Records and Average Velocity
| Sprint Event | Athlete (Year) | Distance (m) | Record Time (s) | Avg Speed (m/s) | Avg Speed (km/h) | Avg Speed (mph) |
| Indoor 60 m (World Record) | Christian Coleman (2018) [en.wikipedia.org] | 60 m | 6.34 s [en.wikipedia.org] | 9.46 m/s | 34.0 km/h | 21.1 mph |
| Outdoor 100 m (World Record) | Usain Bolt (2009) [guinnesswo…ecords.com] | 100 m | 9.58 s [guinnesswo…ecords.com] | 10.44 m/s | 37.6 km/h | 23.4 mph |
Sources: World Athletics Records (men’s 60 m and 100 m). Average speeds are calculated as distance divided by time. [en.wikipedia.org], [guinnesswo…ecords.com]
These elite speeds provide a “worst-case” (fastest) scenario for an approaching aggressor. Realistically, most people – even athletic individuals – are much slower. For example, sports data indicates that physically fit adults typically sprint at about 15–20 mph (24–32 km/h) in short bursts, whereas untrained individuals peak around 12–15 mph. In metric terms, this means a well-conditioned non-elite runner might average roughly 7–9 m/s over a short distance, while an average adult might only manage on the order of 5–7 m/s. These “everyday” running speeds will also be considered in our model to explore less extreme (but more common) threat scenarios. [marathonhandbook.com]
| Sprint Event | Athlete (Year) | Distance (m) | Record Time (s) | Avg Speed (m/s) | Avg Speed (km/h) | Avg Speed (mph) |
|---|---|---|---|---|---|---|
| Indoor 60 m (World Record) | Christian Coleman (2018) | 60 m | 6.34 s | 9.46 m/s | 34.0 km/h | 21.1 mph |
| Outdoor 100 m (World Record) | Usain Bolt (2009) | 100 m | 9.58 s | 10.44 m/s | 37.6 km/h | 23.4 mph |
3. Human Reaction-Time Baseline
Before modeling the checkpoint response, it’s vital to understand human reaction times. Elite sprinters reacting to a starting pistol achieve reaction times as low as ~0.15 seconds on average, with anything below 0.10 s considered physically implausible (and thus a false start by rule). This 0.1 s threshold is essentially a lower bound on simple reaction time in ideal conditions. For most people, and for more complex tasks, typical reaction times are significantly longer. The human visual reaction time (seeing a stimulus and initiating a simple response, like pressing a button) is about 0.25 seconds on average. In laboratory tests, even highly alert individuals usually respond in 0.15–0.30 s to visual signals. When a decision or choice is involved (for instance, distinguishing a threat vs. a non-threat), reaction times increase – often into the 0.35–0.45 s range for choice reaction tasks. These delays come from the brain’s processing: an aggressor running at you is not as simple as a “go” buzzer; the guard must perceive the person, recognize the intent as hostile, then decide on a response. [en.wikipedia.org] [scienceinsights.org]
Moreover, lab measurements of reaction time don’t fully capture the challenge of real-world security scenarios. In a high-stakes, high-stress environment, human performance suffers additional delays due to stress, uncertainty, and the need for high-level judgment. For example, in vehicle safety research, drivers’ total perception-response time in emergencies (like spotting a hazard and braking) has been measured around 1.5 seconds under ideal conditions. This 1.5 s includes the time to perceive a hazard, recognize the threat, decide to act, and then execute a physical response (moving one’s foot to the brake pedal). In a security checkpoint scenario, a guard’s reaction involves a similar series of cognitive and motor steps which can likewise total on the order of 1–2 seconds in practice. Unlike an athlete responding to a starting gun, a guard might be looking at a crowd of people with varying behaviors – the threat may not be immediately obvious, adding precious tenths of seconds as the guard interprets the situation. Stress and fatigue can further slow down each step of reaction. In short, while 0.1–0.3 second reactions are achievable in simple, expected tasks, a complex, unsignaled threat in a real-world environment may take a second or more for a human to process and respond. This human baseline will be our point of comparison for automation. [arcca.com]
4. Checkpoint Geometry Model
We model the core scenario as follows: an aggressor starts sprinting toward a checkpoint barrier from a certain distance, crossing a detection line at distance d from the barrier. At that instant, the guard (and/or the automated system) perceives the threat and begins responding. The time available to respond – i.e. to close the barrier before the runner reaches it – is equal to the intruder’s arrival time at the checkpoint, denoted tarrival. This is given by a simple relation derived from constant speed motion:
tarrival = dcheckpoint / vsprinter
where dcheckpoint is the distance to cover (the gap between the detection line and the secure position of the barrier), and vsprinter is the intruder’s running speed. In reality, a sprinter accelerates from a standstill, meaning the average speed over a short distance is lower than the peak speed. However, if we assume the intruder is already at full sprint by the time the detection line is crossed (a worst-case assumption), we can use a constant v equal to the appropriate average or peak sprint speed for that scenario. Table 2 shows the calculated arrival times for various distances (3 m up to 25 m) under five different speed assumptions:
- 60 m World-Record Average (9.46 m/s): representing an elite sprinter’s average speed over a very short sprint (Christian Coleman’s 6.34 s in 60 m). [en.wikipedia.org]
- 100 m World-Record Average (10.44 m/s): representing an elite sprinter’s average speed over 100 m (Usain Bolt’s 9.58 s run). [guinnesswo…ecords.com]
- Estimated Peak Human Sprint (12.4 m/s): representing an extreme upper bound – roughly the peak speed Usain Bolt reached mid-race (around 27.8 mph).
- Highly Trained (Non-Elite) Sprinter (~8.3 m/s): representing a very athletic individual (e.g., a well-trained security officer or military personnel) – roughly equivalent to a 100 m dash in ~12 seconds.
- Average Adult Running (~6.0 m/s): representing an average reasonably fit adult’s approximate top running speed (around 21–22 km/h, or ~13–14 mph).
Table 2: Estimated Time for a Sprinter to Reach the Checkpoint (tarrival) at Various Distances
| Distance to Checkpoint | 60 m WR Avg (9.46 m/s) | 100 m WR Avg (10.44 m/s) | Peak Human ~12.4 m/s | Highly Fit ~8.3 m/s | Average Adult ~6.0 m/s |
| 3 m (very close) | 0.32 s | 0.29 s | 0.24 s | 0.36 s | 0.50 s |
| 5 m | 0.53 s | 0.48 s | 0.40 s | 0.60 s | 0.83 s |
| 7.5 m | 0.79 s | 0.72 s | 0.60 s | 0.90 s | 1.25 s |
| 10 m | 1.06 s | 0.96 s | 0.81 s | 1.20 s | 1.67 s |
| 15 m | 1.58 s | 1.44 s | 1.21 s | 1.80 s | 2.50 s |
| 20 m | 2.11 s | 1.92 s | 1.61 s | 2.40 s | 3.33 s |
| 25 m | 2.64 s | 2.40 s | 2.02 s | 3.00 s | 4.17 s |
Note: Times computed assuming constant speed (no acceleration phase) for worst-case analysis. Bold speeds are average speeds over the given record distances; 12.4 m/s is an estimated human top sprinting speed; 8.3 m/s and 6.0 m/s are representative non-elite and general public sprint speeds. [en.wikipedia.org], [guinnesswo…ecords.com] [marathonhandbook.com]
From Table 2 we see that at 5 meters or less, an elite sprinter would reach the checkpoint in well under 1 second – leaving extremely little time for any reaction. Even at 10 m, a world-class sprinter arrives in about 0.96 s (under 1 second). For context, a moderately athletic adult (not a trained sprinter) would cover 10 m in about 1.7 s, and an average person in about 2.5 s. Longer distances quickly add a bit more buffer: at 20–25 m, a world-class sprinter is ~2–2.5 s away, and an average runner ~3.3–4.2 s away. These arrival times set the stage for evaluating human and automated response capabilities. The critical question is: can the checkpoint barrier be closed in tarrival seconds or less? If yes, the approaching threat can be stopped in time; if not, the intruder will reach the checkpoint before it’s secured.
| Distance to Checkpoint | 60 m WR Avg (9.46 m/s) | 100 m WR Avg (10.44 m/s) | Peak Human ~12.4 m/s | Highly Fit ~8.3 m/s | Average Adult ~6.0 m/s |
|---|---|---|---|---|---|
| 3 m (very close) | 0.32 s | 0.29 s | 0.24 s | 0.36 s | 0.50 s |
| 5 m | 0.53 s | 0.48 s | 0.40 s | 0.60 s | 0.83 s |
| 7.5 m | 0.79 s | 0.72 s | 0.60 s | 0.90 s | 1.25 s |
| 10 m | 1.06 s | 0.96 s | 0.81 s | 1.20 s | 1.67 s |
| 15 m | 1.58 s | 1.44 s | 1.21 s | 1.80 s | 2.50 s |
| 20 m | 2.11 s | 1.92 s | 1.61 s | 2.40 s | 3.33 s |
| 25 m | 2.64 s | 2.40 s | 2.02 s | 3.00 s | 4.17 s |
5. Human Response Chain
A human security officer’s response to a sudden threat involves a sequence of stages – each contributing to the overall total human response time (Thuman). We break this down into distinct components from the moment the intruder is detected to the moment the barrier is activated:
- Perception: The time for the guard’s sensory system to notice the intruder crossing the detection line. For a focused guard watching a monitor or looking at the scene, this could be very short (on the order of a few hundred milliseconds or less). Visual processing of a sudden, expected stimulus can begin within ~0.1–0.2 s, but in a busy environment it might be longer. [scienceinsights.org]
- Recognition: The time to interpret the person as a threat. The guard must recognize that the fast-approaching figure signifies an attack and not, say, an innocuous jogger or a soldier running to exercise. This cognitive step can add delay; even among trained individuals, distinguishing a threat raises reaction time significantly (typical 0.2–0.5 s for complex decision tasks). [scienceinsights.org]
- Decision: The time to decide on a response – e.g. pressing the emergency close button or lever. Even after recognizing a potential threat, the officer might briefly hesitate or double-check the situation, especially if there is any ambiguity (is the person truly an aggressor?). This decision phase might take on the order of 0.2–0.4 s in a high-pressure scenario.
- Motor Initiation: The neuromuscular delay to initiate movement. Once the decision to act is made, the officer’s brain sends a signal to the muscles (arm/hand) to move. Human nerve conduction and muscle activation introduce a small lag (tens of milliseconds). For example, research on sprinters shows around 0.05–0.10 s for the muscle to start producing force after the “go” decision, even under ideal conditions. [basvanhooren.com], [basvanhooren.com]
- Manual Activation: The time to physically perform the action, such as hitting a button or pulling a lever to close the barrier. This could be fairly quick (perhaps ~0.1–0.3 s to move one’s hand and press a button), but it depends on whether the control is immediately at hand and how easy it is to activate (e.g. slamming a palm onto an emergency shut-off button might be faster than grabbing and turning a key or entering a code).
- Barrier Closure Initiation: Once the control is activated, the signal is sent and the barrier begins moving. For a human-operated system, this stage might be essentially instantaneous (pressing the button closes a circuit and power is sent to the actuator with negligible additional delay).
- Mechanical Closure Time: Finally, the physical barrier closes, taking a certain amount of time to deploy. Modern high-speed security doors or fast-acting turnstile barriers typically close in about 0.3–0.8 seconds, depending on the design (for example, a lightweight half-height turnstile “flap” gate can shut in ~0.3 s, whereas a heavy full-sized gate or bollard might take closer to 1.0 s). This duration is the same whether triggered by a human or an automated system – it is a property of the mechanical system and its motors or actuators. [turbooturnstile.com]
Response Chain Comparison
Human operator
- Perception
- Recognition / threat ID
- Decision
- Motor initiation
- Manual activation
- Mechanical closure
Typical total: ~1.5 s
Automated system
- Sensor capture
- AI / model inference
- Decision thresholding
- Control signal dispatch
- Actuator onset
- Mechanical closure
Typical total: ~1.0 s
Same barrier, earlier trigger: the machine’s edge comes from replacing slower human perception, recognition, and decision steps with faster sensing and computation.
Table 3: Human Checkpoint Response Time Components – Estimated Ranges
| Human Response Component | Low (Optimistic) | Typical | High (Conservative) |
| Perception (Visual sensing) | ~0.1 s | 0.2 s | 0.3 s |
| Recognition & Threat ID | ~0.1 s | 0.3 s | 0.5 s |
| Decision (Action selection) | ~0.1 s | 0.3 s | 0.5 s |
| Motor initiation (reaction) | ~0.1 s | 0.2 s | 0.3 s |
| Manual activation (trigger) | ~0.1 s | 0.2 s | 0.3 s |
| Barrier mechanical closure | 0.3 s | 0.5 s | 0.8 s |
Note: These values are based on human factors research and simulations. In the best case, a trained, alert operator facing a clear-cut threat could potentially react in under a second total (summing the low-end values ~0.8 s). In a typical scenario (attentive but some uncertainty), ~1.5 s is a reasonable total response estimate. In a high-end (worst-case) scenario – e.g. the operator is momentarily distracted or the threat is ambiguous – the response might stretch to 2+ seconds. The mechanical barrier closure time (last row) is shown in bold to emphasize that it is a physical constraint common to both human and automated systems (we assume the same type of barrier in both cases). In many cases this closing time dominates the overall response, so it is crucial to have a fast-acting barrier. [arcca.com]
It is important to recognize that human performance can vary widely. Some of the components above can overlap or be trained to some extent (for instance, a well-drilled guard might effectively collapse recognition and decision into one rapid intuitive judgment, shaving off a few tenths of a second). Conversely, under stress or confusion, some stages can take longer. For example, a security officer at an entry control point might need extra moments to confirm that the person sprinting is unauthorized and not a fellow soldier in an emergency – those extra moments of “benefit of the doubt” can consume the last fraction of the available time and lead to a delayed response. The human response chain is only as fast as its slowest link in a given situation. In practice, even with an excellent, vigilant guard and an obvious threat, around one second is likely the fastest practical human-triggered response, and more often closer to 1.5 seconds or more. This is the baseline against which we compare an automated system. [arcca.com]
| Human Response Component | Low (Optimistic) | Typical | High (Conservative) |
|---|---|---|---|
| Perception (visual sensing) | ~0.1 s | 0.2 s | 0.3 s |
| Recognition & threat ID | ~0.1 s | 0.3 s | 0.5 s |
| Decision (action selection) | ~0.1 s | 0.3 s | 0.5 s |
| Motor initiation (reaction) | ~0.1 s | 0.2 s | 0.3 s |
| Manual activation (trigger) | ~0.1 s | 0.2 s | 0.3 s |
| Barrier mechanical closure | 0.3 s | 0.5 s | 0.8 s |
6. Automated Response Chain
In an automated security checkpoint system, the detection and response sequence is different. It involves sensors and algorithms rather than conscious human perception and decision-making. We define the total automated response time Tauto as the sum of these components (some in parallel and some sequential, depending on system design):
- Sensor Capture: A sensor must first detect the intruder at the detection line. This could be a video camera frame capture, a laser trip-beam, radar, infrared motion detector, etc. A high-frame-rate camera might capture an image of the subject within ~0.017–0.033 s (1–2 video frames at 30–60 fps). Some specialized sensors (LIDAR or break-beam sensors) can detect an object entering an area almost instantaneously (~milliseconds). In most cases, sensor latency is a very small contributor (on the order of only few hundredths of a second).
- Inference/Processing: Next, the system’s algorithm processes the sensor data to determine if there is a threat. For a computer vision system, this is the model inference latency – running the image through object detection or human pose analysis model. Modern optimized algorithms can run in a few tens of milliseconds on powerful processors (e.g. 30–100 ms for a frame on a typical edge AI device). We will assume a ballpark of ~0.05–0.2 s for the AI to analyze the data and “recognize” a person as a threat. In cases where sensor input is simpler (like a floor pressure sensor or break-beam), this could be shorter.
- Classification/Decision Thresholding: Often, an automated system might wait for a certain level of confidence or perhaps a second sensor confirmation to classify the target as a genuine threat. For example, the system may require that the object’s speed or trajectory exceeds a threshold to trigger an alarm, or verify the detection in two consecutive camera frames to avoid false alarms. This step might introduce a slight additional delay, perhaps ~0.1–0.2 s in more cautious systems. In a high-speed “reflex” system this could be essentially zero if the first detection immediately triggers action.
- Control Signal Transmission: Once the system decides to act, it must send a command to the barrier’s actuation mechanism (e.g. an electronic relay signal to a motor or hydraulic actuator). This communication is typically very fast (microcontroller or circuit switching delays on the order of milliseconds, say 0.01–0.05 s). Even wireless signals travel at near the speed of light, so the limiting factor is usually processing and relay actuation times, which are negligible compared to other steps.
- Actuator Response: This is the time for the barrier’s motor or actuator to engage and begin moving the physical barrier. High-quality electromechanical or hydraulic actuators can spin up quickly, but there may be a short delay as the motor applies torque. This can range from nearly instantaneous (for some pyrotechnic or spring-triggered mechanisms) to perhaps 0.1–0.3 s for others. In practice, good active vehicle barriers and fast doors often achieve full motion in well under a second.
- Barrier Mechanical Closure: Finally, similar to the human case, the physical barrier must fully close to stop the intruder. As noted earlier, many modern security barriers have closing times between ~0.3 and 0.8 s for pedestrian-sized gates or turnstiles. We will use the same values here. [turbooturnstile.com]
Table 4: Automated System Response Time Components – Typical Latency Ranges
| Automated Response Component | Low-Latency | Typical | High-Latency |
| Sensor detection & capture | ~0.01 s | 0.03 s | 0.10 s |
| AI/Model inference | ~0.05 s | 0.20 s | 0.50 s |
| Decision thresholding | ~0 s | 0.10 s | 0.20 s |
| Control signal dispatch | ~0.01 s | 0.05 s | 0.10 s |
| Actuator onset | ~0.05 s | 0.10 s | 0.30 s |
| Barrier mechanical closure | 0.3 s | 0.5 s | 0.8 s |
Note: These values are based on reported performance of high-speed automation components. For instance, a cutting-edge system can use high-frame-rate sensors and custom chips to cut visual processing to under 0.05 s – recent research prototypes have demonstrated machine “reflexes” that detect and react to visual stimuli in 0.5 s or less, compared to ~0.15 s human brain reaction in similar tasks. The “sensor+inference” pipeline in our typical case (~0.20–0.30 s combined) reflects a modern computer vision model running on a suitable processor, which can often analyze video at 30–50+ frames per second. The mechanical closing time (bold row) remains a large fraction of the total; even the best AI cannot overcome the laws of physics and machinery – a heavy barrier can only close so fast without causing unsafe forces. [interestin…eering.com]
Comparing Table 3 and Table 4 clearly shows the potential advantages of automation. The cognitive steps (recognition/decision) that slow down human reactions are replaced by machine perception and computation, which can operate much faster in routine conditions. The elimination of human indecision and the raw speed of electronics mean an automated system might start closing a barrier perhaps a half-second (or more) sooner than a human would. On paper, Tauto could be well under 1 second in ideal cases – for example, summing the “Typical” values in Table 4 yields roughly 0.5–0.6 s until the barrier starts moving, vs. ~1.0 s for the human (Typical ~1.0 s to decide and act) before the same mechanical closing time is added for both. In practice, real systems have some overhead – for instance, an integrated security AI might operate at lower frame rates or require multiple sensor readings to confirm a threat, adding latency. Environmental factors (lighting, motion blur, etc.) can also extend the inference or classification time. Nonetheless, even a basic automated system is likely to respond in well under 1 second total, significantly faster than a human’s response under pressure. The automated sequence is also more consistent, not prone to the variations in attention and decision-making that humans experience. The trade-off, as we will discuss, is that the automated system must be reliable – it has to correctly identify true threats quickly without succumbing to false alarms or missed detections.
| Automated Response Component | Low-Latency | Typical | High-Latency |
|---|---|---|---|
| Sensor detection & capture | ~0.01 s | 0.03 s | 0.10 s |
| AI / model inference | ~0.05 s | 0.20 s | 0.50 s |
| Decision thresholding | ~0 s | 0.10 s | 0.20 s |
| Control signal dispatch | ~0.01 s | 0.05 s | 0.10 s |
| Actuator onset | ~0.05 s | 0.10 s | 0.30 s |
| Barrier mechanical closure | 0.3 s | 0.5 s | 0.8 s |
7. Delta Analysis
We now combine the sprint approach timings with the response times to quantify the outcomes. For a given distance and intruder speed, we compare:
- Total Human Response Time (Thuman): from detection to full barrier closure, as defined in Section 5.
- Total Automated Response Time (Tauto): from detection to full barrier closure, as defined in Section 6.
- Time to Checkpoint (tarrival): as calculated in Section 4 for the given distance and speed.
From these, we define two important measures:
- Human Safety Margin (Mhuman) = tarrival – Thuman: the time remaining after a human-operated barrier closes before the intruder would have arrived. A positive margin means the barrier closes in time (with that much time to spare); a negative value means the intruder arrives first.
- Automated Safety Margin (Mauto) = tarrival – Tauto: similarly, the time remaining (if any) after an automated system’s barrier closure.
- Automation Benefit (Δ Benefit) = Thuman – Tauto: the difference in total response time between human and machine. This is effectively how much faster the automated system is.
- Safety Margin Improvement (Δ M) = Mauto – Mhuman: the increase in safety margin provided by automation. Notably, in a scenario where the same barrier is used for both, ΔM should equal ΔBenefit (since the difference in margins comes only from reacting earlier – the closing time portion is the same for both). A positive ΔM (or Δ Benefit) means the automated system provides extra time (and closes the gate earlier) compared to the human response, which is the desired outcome.
Using representative values for Thuman and Tauto (from the “Typical” columns of Tables 3 and 4), we can compute these metrics for various distances. Let’s assume a world-record level intruder (100 m WR average speed ~10.44 m/s) as the worst-case threat. We take Thuman ~1.5 s and Tauto ~1.0 s for a baseline comparison. Table 5 presents the results for selected checkpoint distances under that extreme sprint speed assumption:
Table 5: Human vs. Automated Response at Selected Distances (World-Class Sprint Speed ~10.4 m/s)
| Distance | Thuman (s) | Tauto (s) | tarrival (s) | Mhuman (s) | Mauto (s) | Δ Benefit (s) |
| 5 m | 1.5 s | 1.0 s | 0.48 s | –1.02 s (missed) | –0.52 s (missed) | 0.50 s |
| 10 m | 1.5 s | 1.0 s | 0.96 s | –0.54 s (missed) | –0.04 s (barely) | 0.50 s |
| 15 m | 1.5 s | 1.0 s | 1.44 s | –0.06 s (missed by ~0.06) | 0.44 s (success) | 0.50 s |
| 20 m | 1.5 s | 1.0 s | 1.92 s | 0.42 s (success) | 0.92 s (success) | 0.50 s |
In Table 5, negative safety margins (in bold red text) indicate the barrier would not close in time. For instance, at only 5 m, neither the human nor automated system can prevent a breach – the intruder arrives roughly half a second before even an automated barrier could shut. At 10 m, a human-operated barrier misses by about 0.5 s, whereas an automated system comes within a few hundredths of a second of preventing entry (just barely failing in this worst-case scenario). By 15 m, the automated system manages to close the barrier with nearly half a second to spare, whereas a human operator still falls short by a few hundredths of a second (essentially no safety margin, likely resulting in the intruder forcing the gate before it’s fully locked). At 20 m, both human and automated responses succeed, but the automated system’s barrier has about 0.5 s greater safety margin than the human’s. This means that even if the intruder’s speed were slightly higher than anticipated (or if the system faced a slight delay), the automated closure is far likelier to still succeed, whereas the human-operated closure had very little slack.
| Distance | TH (s) | TA (s) | t (s) | MH (s) | MA (s) | Δ Benefit (s) |
|---|---|---|---|---|---|---|
| 5 m | 1.5 s | 1.0 s | 0.48 s | −1.02 s (missed) | −0.52 s (missed) | 0.50 s |
| 10 m | 1.5 s | 1.0 s | 0.96 s | −0.54 s (missed) | −0.04 s (barely) | 0.50 s |
| 15 m | 1.5 s | 1.0 s | 1.44 s | −0.06 s (missed by ~0.06) | 0.44 s (success) | 0.50 s |
| 20 m | 1.5 s | 1.0 s | 1.92 s | 0.42 s (success) | 0.92 s (success) | 0.50 s |
Distance Threshold Snapshot
Assumes world-class sprint speed (~10.4 m/s), human total response ~1.5 s, automated total response ~1.0 s.
5 m
Human: missed
Automated: missed
10 m
Human: failed
Automated: nearly succeeds
15 m
Human: marginal failure
Automated: succeeds
20 m
Human: succeeds
Automated: succeeds with more margin
These calculations make clear that there is a minimum distance threshold below which a human operator cannot reliably stop a sprinting attacker. In our model, with the assumptions given, a human-operated checkpoint needs on the order of ~15–18 m head start against an elite sprinter to confidently close a barrier in time (around 1.5 s reaction + 0.5 s door = 2.0 s total, requiring ~20 m at 10 m/s). At distances shorter than ~10–12 m, even advanced automation may not compensate for the simply limited time available. The automated system’s advantage of a few tenths of a second can make the difference in the intermediate range – for example, between 10–15 m, where a human might be too slow but a machine could still succeed. Importantly, the automation time advantage (Δ Benefit) in our analysis is about 0.5 s across scenarios (since we assumed 1.5 s vs 1.0 s). If the intruder is slower (say an average person), the absolute time to reach the target is longer and both human and machine have more breathing room; but the relative advantage of the machine remains roughly the same (hundreds of milliseconds). What if the intruder is even faster than our assumptions, or the guard even slower? The next section (sensitivity analysis) explores how changes in key parameters affect this time delta.
Time 0.00 s – Intruder crosses detection line
The intruder has been detected at a distance d from the checkpoint. The clock starts for both human and automated responses. The sprinter will cover the remaining distance in tarrival seconds.
Time ~0.20 s – Human perceives and recognizes threat
The guard becomes aware of the approaching person (visual perception) and, almost instantly but not reflexively, identifies the situation as a threat. Meanwhile, the automated camera has captured the intruder’s image within ~0.03 s and the AI model flags a high-speed incoming person by ~0.15–0.20 s.
Time ~0.50 s – Human decides on emergency action
After a brief moment of deliberation, the human initiates the decision to hit the emergency shutdown. The automated system, having surpassed its trigger threshold, sends a command to the barrier actuator around this time (or even earlier, e.g., ~0.3 s).
Time ~0.70–1.00 s – Barrier activation begins
The human operator physically presses the button/pull lever (by ~0.7–0.8 s). The automated system’s actuator likely began moving at ~0.3–0.5 s. In both cases, the barrier is now closing.
Time ~1.20–1.60 s – Barrier closed (Threat hopefully contained)
The barrier completes its mechanical travel and reaches a fully closed, secure position. In our example, the automated system may finish by ~1.2 s, whereas the human-initiated closure finishes around ~1.5 s. The intruder’s arrival time relative to this moment will determine success or failure of containment.
Figure 1: Timeline comparison of an example scenario (assumes a threat at ~15 m, moving ~10 m/s). The automated system begins closing the barrier several tenths of a second earlier than the human operator. The safety margin – the gap between barrier closure and intruder arrival – is accordingly larger for the automated response.
The timeline above illustrates qualitatively how an automated system can “get a head start” on closing the checkpoint. If the intruder is far enough away, both human and machine will successfully close the barrier; the key difference is how much time is left over before the intruder would have arrived (this is the safety margin we defined). Conversely, if the intruder starts very close, neither may be able to prevent a breach. In between these extremes lies a critical range of distances where automation can mean the difference between a successful stop or a failure. This is the primary “delta” we are concerned with: how much additional reaction time does the automated system provide, and is it enough to matter?
To visualize this, consider a sprinter moving at about 12 m/s (roughly 43 km/h, approaching our worst-case scenario). A human with a nominal 1.5 s total reaction would require the intruder to be at least ~18 m away to reliably close the gate; an automated system with ~1.0 s total reaction could manage with the intruder only ~12 m away. Figure 2 shows the safety margin vs. distance for this scenario, highlighting that the automated system extends the protective range of the checkpoint by several meters. In essence, automation can “buy” roughly an extra 0.5 seconds of time (or ~5 meters of distance) across a wide range of situations – a significant edge when total available time is only 1–2 seconds.
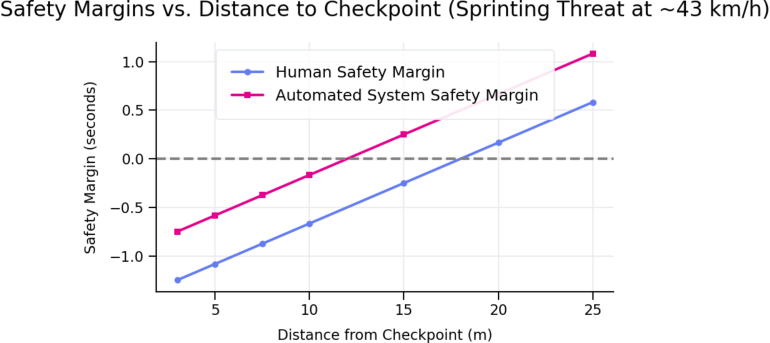
Figure 2: Safety margin (time remaining after barrier closure) as a function of distance for a human responder vs. an automated system, assuming an intruder sprinting ~12 m/s (≈43 km/h). A positive margin means the barrier closes before intruder arrival. The automated system consistently achieves about a 0.5 s larger margin than the human, effectively shifting the minimum safe distance closer to the checkpoint. [arcca.com], [interestin…eering.com]
8. Jensen’s Alpha-Style Performance Analysis
To assess the benefit of automation in a holistic, risk-adjusted way, we draw an analogy from the world of finance. Jensen’s Alpha (α) is a metric originally used in investment performance to measure excess return above a benchmark, after adjusting for risk (via the CAPM model). In financial terms, Jensen’s alpha for an investment or portfolio i is defined as: [en.wikipedia.org]
αi = Ri − [Rf + βi(Rm − Rf)]
where Ri is the actual return of the portfolio, Rm is the return of the market or benchmark, Rf is the “risk-free” rate (baseline minimum return), and βi is the beta of the portfolio (a measure of its sensitivity to market risk). A positive α indicates the portfolio outperformed the expected return for its risk level (adding value beyond what the market would predict), while a negative α indicates underperformance.
To apply this concept to checkpoint responsiveness, we redefine the terms in the context of time savings (since faster reaction is better, analogous to higher returns in finance, and “risk” corresponds to scenario difficulty which makes it harder to achieve fast responses):
- Δti: The actual time saved by the automated system versus a human in a given scenario. This is essentially the Δ Benefit (Thuman – Tauto). For example, if the human takes 1.5 s and the automation takes 1.0 s, then Δti = 0.5 s.
- Δtf: The minimum required time-saving to justify automation – analogous to a “risk-free” improvement. This could be set by policy or engineering requirements. For instance, one might say any automated barrier must save at least 0.1 s over a purely mechanical (non-AI) automatic door, to be worth it.
- Δtm: The market benchmark time-saving – how much time saving is provided by comparable automated security systems on the market. For example, if typical automated turnstile systems close 0.3 s faster than a human guard, we could take Δtm = 0.3 s as an industry benchmark improvement.
- βi: The system’s sensitivity to scenario difficulty, analogous to beta in finance. If βi = 1.0, the system’s performance degrades in difficult conditions similarly to the benchmark. βi > 1 means the system is more sensitive (for example, it loses more of its speed advantage in poor conditions than an average system), whereas βi < 1 means it is more robust than typical to difficult conditions.
We can then define a response-time Jensen’s alpha (αt) as:
αt = Δti − [Δtf + βi(Δtm − Δtf)]
This measures the excess time-saving our particular automated system i provides beyond what would be expected given the baseline and the difficulty of conditions. A positive αt means the system is performing better than anticipated (creating more time buffer than one might predict for its environment), whereas a zero or negative αt means it’s performing at or below expectations. This performance metric is useful for evaluating whether a new automated checkpoint technology truly “beats the market” of existing solutions after factoring in the challenges it faces (for example, poor lighting or heavy crowd movement could be reflected in a higher β value, raising the expected time loss).
Key Equations
Time to checkpoint: t = d / v
Human safety margin: MH = t − TH
Automated safety margin: MA = t − TA
Automation benefit: ΔBenefit = TH − TA
Safety margin improvement: ΔM = MA − MH
Jensen’s Alpha-style metric: αi = Δti − [Δtf + βi(Δtm − Δtf)]
Here, Δti is the actual automation gain, Δtf is the baseline gain, Δtm is the benchmark gain, and βi is the operating-condition difficulty.
Table 6: Jensen’s Alpha Analogy – Example Calculations for Automated Response Performance
| Scenario | Δti (Actual Gain) | Δtf (Baseline) | Δtm (Benchmark) | βi (Difficulty) | αt (Excess Gain) | Interpretation |
| Ideal/Lab Conditions | 0.50 s | 0.10 s | 0.30 s | 0.8 | +0.24 s | Exceeds expectations – strong positive alpha (outperforms benchmark significantly). |
| Standard Field Scenario | 0.40 s | 0.10 s | 0.30 s | 1.0 | +0.10 s | Slightly above expectations – positive alpha (nominal improvement over baseline). |
| Adverse Conditions | 0.20 s | 0.10 s | 0.30 s | 1.3 | –0.16 s | Underperforms expectations – negative alpha (benefit erased by difficulty factors). |
In Table 6, we use hypothetical values to demonstrate how αt might be evaluated. In the ideal case, our system saves 0.50 s compared to a human (perhaps in a controlled test), the minimum required was only 0.10 s, and peers average 0.30 s; with β = 0.8 indicating the test conditions were easier than typical (perhaps good lighting, simple scenario). The result is a strongly positive αt (~+0.24 s), meaning the system delivered more than double the expected baseline improvement. In a realistic scenario, the system saves 0.40 s, with similar expected baseline and β = 1 (average difficulty); αt comes out modestly positive (~+0.10 s), indicating it slightly beats the expected value. However, in adverse conditions (say poor lighting, bad weather, β = 1.3 reflecting higher difficulty), the measured time saving drops to 0.20 s (perhaps the system’s sensors and algorithms slowed down), while expectations were higher (0.36 s needed). Here αt is negative (–0.16 s), signaling the system failed to achieve the improvement anticipated for its “risk profile.” In other words, the automation did not provide any net time advantage after accounting for the challenging conditions – a warning sign that under certain conditions, the automation might not be worth the cost or complexity.
This Jensen’s Alpha-like analysis is a way to think beyond raw speed and consider whether an automated checkpoint is truly delivering value relative to simpler solutions. If, for instance, αt is zero or negative once factors like low-light performance or rain (which might reduce the AI’s accuracy or speed) are considered, then the automated system isn’t really adding meaningful time margin compared to a cheaper or safer alternative. On the other hand, consistently positive αt across scenarios would indicate the system provides a robust time advantage even after “stressing” it with various real-world difficulties – a strong argument for its deployment.
| Scenario | Δti (Actual Gain) | Δtf (Baseline) | Δtm (Benchmark) | βi (Difficulty) | αi (Excess Gain) | Interpretation |
|---|---|---|---|---|---|---|
| Ideal / Lab Conditions | 0.50 s | 0.10 s | 0.30 s | 0.8 | +0.24 s | Exceeds expectations — strong positive alpha. |
| Standard Field Scenario | 0.40 s | 0.10 s | 0.30 s | 1.0 | +0.10 s | Slightly above expectations — positive alpha. |
| Adverse Conditions | 0.20 s | 0.10 s | 0.30 s | 1.3 | −0.16 s | Underperforms expectations — negative alpha. |
Jensen’s Alpha-Style View
Ideal
+0.24 s
Automation strongly exceeds expected gain.
Standard
+0.10 s
Automation modestly outperforms the benchmark.
Adverse
−0.16 s
Environmental difficulty erodes the automation benefit.
9. Sensitivity Analysis
How robust is the automated advantage under different conditions? In this section, we qualitatively examine how changes in key parameters affect the outcome. Security scenarios are rarely “clean”: an array of factors can slow down an automated system’s responsiveness or a human’s reaction, and physical variations can change the dynamics. Below, we consider how the automation time delta and safety margins might change with various factors:
- Distance to the checkpoint: This is the most straightforward factor – shorter distances drastically cut the time available. As seen in Table 2 and Figure 2, every meter counts. A human-operated system might effectively handle an intruder 20 m away, but at 10 m the same intruder will outrun the closure. The automated system can compensate for some reduction in distance, perhaps buying a 30–50% reduction in the required distance. But below ~5–7 m, even the fastest automated system has virtually no time to act before impact. Thus, there is a lower bound on distance below which no system can safely react in time (barring other mitigations like physical restraints or non-kinetic deterrents).
- Sprint speed of the intruder: All else equal, a faster intruder means less time to respond. If an intruder is slower than world-class (which is likely – 9.58 s for 100 m is exceptional), the time-to-target increases. For instance, an average adult running at ~6 m/s takes about 1.67 s to cover 10 m (versus ~0.96 s for a world-record sprinter). Extra speed from the attacker has a non-linear effect: shaving even 0.2–0.3 s off their travel time can turn a marginally successful stop into a failure. Automation’s benefit is also effectively “less” in absolute terms against a faster attacker because the total available time is smaller. However, the fractional improvement remains the same – e.g., if the machine saves 0.5 s and the intruder runs 20% faster, that 0.5 s is still the same fraction of the run time. In practice, security design should assume the worst-case speeds (possibly using the world-record 100 m speed of ~10.4 m/s as we have) for a conservative safety margin. [guinnesswo…ecords.com]
- Model inference latency: The speed of the AI or detection algorithm is crucial. Using faster processors or more efficient algorithms can cut down inference time from, say, 200 ms to 50 ms – a significant gain. For example, research on autonomous vehicle vision chips shows reaction reductions of a few tenths of a second can translate to many feet of stopping distance saved. If the model is too slow (high computational load or old hardware), the automation advantage shrinks. Ensuring the algorithm runs in real-time (with optimized code, possibly lower resolution or simplified models to guarantee quick inference) is critical to maintain the speed edge. [interestin…eering.com]
- Sensor quality and conditions (lighting, weather): Poor lighting or adverse weather (rain, fog) can degrade camera sensor input, requiring more processing or causing delays or errors in recognition. In low light, exposure times might be longer or the system might switch to an infrared mode with lower resolution – either way, potentially increasing tsensor or tinference. Similarly, visual occlusion or crowd density (multiple people in frame) could delay the threat classification step. A thermal sensor might help detect fast motion at night, but could be confused by hot objects or require more complex filtering. Redundancy and sensor fusion (combining, say, a camera and a LiDAR or radar) may mitigate some of these issues but add a small time overhead. We modelled a “difficulty” factor β in the Jensen’s alpha analysis to reflect that – in tougher scenarios, the system might need extra time or might have a lower effective Δti.
- Actuator and barrier mechanics: The design of the physical barrier is a major factor. A lightweight, fast actuator (e.g. a rapid drop-arm or flap gate with a small mass) can close in a fraction of a second, preserving the time gained by quick detection. A heavier, motorized vehicle gate or full-height turnstile door might move slower due to momentum and safety (to avoid injuring people or causing destructive forces). If the mechanical closure time is too long (say 1.5–2 seconds for a heavy gate), then even a perfect zero-latency sensor would still need that long to physically block the passage – meaning an intruder 10 m away would get through regardless of who or what triggers the closure. In such cases, the automation must possibly focus on earlier detection (e.g., placing detection sensors further out to effectively increase d) rather than just faster reaction. The slowest element in the chain dictates overall performance, and often that is the mechanical movement. [turbooturnstile.com]
- False Positive rate: An aggressive false positive (FP) setting (closing the barrier for many perceived threats that turn out to be benign) can actually reduce security in practice – if the system cries wolf too often, guards might start overriding or ignoring it, or leaving the barrier open to avoid constant disruptions. High FP rates can also cause unintended harm (imagine a fast door slamming when someone innocent runs toward it, potentially causing injury). Therefore, many automated systems include a classification confidence threshold (as discussed) or require multi-factor triggers, which can introduce a delay. Tuning the system involves balancing speed and confidence: lowering the threshold gives faster responses but more false alarms, whereas raising it verifies the threat more carefully but delays the response. The optimal point is scenario-dependent. Crucially, if false positives are not well managed, the effective advantage of automation could be nullified by the system being deactivated or disregarded by human operators due to nuisance alarms.
- False Negative risk: A false negative – failing to recognize a genuine threat – is obviously dangerous. A system that is extremely fast but has a high miss rate offers a false sense of security. Engineers must ensure that speeding individuals are reliably detected. If the automation has even a few percent chance of missing a real sprinter (e.g., due to unusual clothing, lighting, or evasion tactics), the whole premise of faster-than-human reaction fails. In high-risk installations, designers may use redundant sensing modalities (e.g., combining video analytics with radar that measures incoming speed) to reduce false negatives, albeit at the cost of more complexity and possibly more processing time.
- Closure timing vs. intruder speed: We revisit the question: Does the automation’s time savings remain meaningful once the mechanical closure time is included? In our analysis, yes – because the automated system triggers the closure earlier, the barrier will always finish closing that same time delta sooner than it would under human control. However, if the closure device requires a long time to actually deploy, that overall delay affects both human and machine. For example, if the barrier takes 2 seconds to close, an intruder who arrives in 1.5 seconds will overwhelm the gate regardless of whether it was initiated by a human or a machine – in both cases 2.0 s is needed. In such situations, the focus must shift to decreasing the physical closure time (for instance, using faster motors, shorter travel distances, or multiple barriers creating “layered” delays) in addition to speeding up detection.
- Minimum automation speed needed: One clear finding from our model is that if the automated system’s total response time isn’t substantially less than the human’s, it might not provide any real benefit. For a positive ΔBenefit, we require Tauto < Thuman. Practically, if a human averages ~1.5 s to react, the automated system should aim for perhaps under ~1.0 s in total to offer a meaningful safety margin (a smaller improvement, say 0.1–0.2 s, might be within the variability of human reaction times or could be negated by slight changes in the intruder’s speed or position). Thus, the design target could be, for example, “achieve closure in under 1.0 second 90% of the time,” to confidently outperform human responders. If an automated system is only marginally faster (e.g., 1.3 s vs 1.5 s), the real-world difference is minor. Our calculations suggest aiming for at least 30–50% faster reaction+closure times than a human to ensure the investment in automation is justified by a tangible performance gap.
In summary, the automated system’s time advantage is sensitive to many factors. It shines brightest in clear, controlled scenarios (a single obvious intruder, good environmental conditions, fast hardware) where it can consistently beat human reflexes by a wide margin. Its edge diminishes if any part of the chain slows down or if conditions force a more cautious response. System designers should perform extensive sensitivity testing – varying the lighting, weather, number of people, clothing and backgrounds, etc. – to ensure the automated checkpoint still provides a net time advantage (positive αt) under the range of real-world conditions expected. This includes testing with different approach speeds and distances to cover both the fastest and slowest potential intruders.
10. Safety, Legal, and Ethical Constraints
When implementing an automated checkpoint closure system, especially one intended to stop human intruders (as opposed to vehicles), a host of safety, legal, and ethical factors come into play. We emphasize that our scenario is limited to non-lethal, physical access control (e.g., rapidly closing gates, drop arms, turnstiles, or bollards) – not automated firearms or lethal force. Within that scope, important considerations include:
- False Positives & Innocent Parties: The system must be designed to minimize false alarms. If the barrier closes on someone who is not actually a threat – for instance, an authorized person who happens to be running to catch a bus or someone who didn’t hear instructions to slow down – it could cause injury or at least alarm. Procedures might be needed to quickly override or reverse the barrier if a mistake is realized, and to ensure that legitimate users can safely pass when authorized. Proper signage and training can help mitigate some of these issues (e.g., instructing people not to run at the gate, or using sensors to differentiate approach vectors).
- Injury Risk from Fast Closure: A barrier that closes fast enough to stop a sprinter inherently carries kinetic energy. There is a risk of impact injuries – for example, a fast-descending gate could hit a person. To mitigate this, designers might include safety interlocks such as pressure sensors or breakaway features (similar to elevator doors that reopen if they hit an object). In some cases, a two-stage approach might be used: a soft barrier that pops up first as a warning or initial buffer (causing less harm), followed by a stronger barrier. The system must comply with safety standards (for instance, ASTM or IEC standards on door/gate safety) to ensure that any automatic closure does not create a greater hazard than the threat it’s trying to prevent.
- Emergency Egress and Fail-Safe Modes: Any access control system must allow people inside to escape in an emergency (fire, etc.). An automated barricade should be integrated with fire alarm systems to either stay open or open automatically during emergencies. It should also fail safe – for example, power loss might trigger the barrier to default to an open or closed state depending on which is safer. The system should have manual override capabilities: a guard or responder should be able to manually open the barrier if needed (e.g. to let emergency responders through or to avoid trapping people in a dangerous area).
- ADA/Accessibility: If this system is deployed at, say, a secure building entrance, it must accommodate individuals with disabilities. A person in a wheelchair moving quickly could potentially trigger the system – the design must not inadvertently discriminate or cause harm. Possible solutions include adjusting sensor algorithms to recognize assistive devices or providing alternative pathways. The Americans with Disabilities Act (ADA) and similar regulations require that security measures do not unnecessarily impede or endanger disabled persons.
- Use-of-Force Doctrine (Non-lethal): While a fast-closing gate is not a weapon, it is a use of force in a broad sense. Policies should define under what conditions an automated closure is permitted. For example, the system might only activate when a person is moving above a certain speed and traveling in the wrong direction through an entry point. The concept of proportionality and necessity in security responses still applies – you wouldn’t want an automated system that closes a heavy door on every person who moves a bit quickly.
- Accountability and Audit Trails: Automation in security can raise questions of accountability. It is important to maintain audit logs of each activation: the system should record sensor data and decisions (possibly even save video footage of what it saw as a threat) to allow post-incident review. If someone is injured by the barrier, these logs will be crucial for investigating what went wrong – whether the system malfunctioned or properly responded to a perceived threat.
- Legal Liability: If an automated system injures an innocent person (or fails to stop a guilty one), who is liable? The agency operating the system might face lawsuits, and vendors might face product liability claims. Clear warnings, rigorous testing, and perhaps even regulatory approvals (e.g., safety certifications) are necessary to navigate the legal landscape. In some jurisdictions, automated physical security systems may be subject to specific regulations or standards – for example, OSHA (occupational safety) rules if in a workplace, or local building codes for egress.
- Privacy and Surveillance Ethics: While not directly about reaction time, any automated system with computer vision raises privacy concerns. Cameras with AI might be perceived as surveillance overreach unless their use is well-justified to occupants. Being transparent about the system’s purpose (stopping imminent threats) and ensuring data is used only for security (with proper cybersecurity) are important ethical considerations.
- Operational Training and Integration: Guards need to be trained on how to work with the automated system. A human-in-the-loop approach is often wise: for instance, the system might issue an alert or even start closing a barrier, but a human can override or reverse if they judge it to be a false alarm. Establishing trust in the system is key; otherwise, operators might disable it. Therefore, gradual testing and training are ethical and practical necessities – rolling out the system in a way that operators gain confidence in its reliability.
In summary, the push for faster reaction times via automation must be balanced with fail-safes and policy safeguards. The system should be designed to handle edge cases gracefully – slowing or stopping if a person is detected in the path, allowing easy manual override, and never locking people in an area unsafely. It should be subjected to thorough testing under various conditions, including high traffic volumes, to ensure it doesn’t create new hazards. Legal review should ensure compliance with all safety regulations and that responsibility in various failure modes is clearly assigned and mitigated. Ethically, the use of automated force (even non-lethal) against humans requires transparency, oversight, and safeguards – the goal is to enhance security without unduly infringing on personal rights or safety.
11. Findings
Our analysis indicates that **automated, AI-driven checkpoint closure systems can indeed provide a measurable and meaningful time advantage over purely human-operated systems, especially at close ranges. However, this benefit manifests under certain conditions and diminishes under others:
- Automation provides a clear speed advantage: In quantitative terms, an automated system can reduce the reaction+closure time by roughly 0.3–0.5 seconds compared to a human operator in many scenarios. This corresponds to gaining an extra 4–5 meters of stopping distance for a sprinting intruder – often the difference between containment and breach.
- Critical distance thresholds identified: A human operator at a checkpoint likely cannot reliably stop a threat that starts within roughly 10–12 meters, given human reaction time limitations. An automated system can shrink that “dead zone” significantly – perhaps enabling effective response at distances as short as ~7–10 m (depending on barrier speed and exact system latency). This extends the protective perimeter by a valuable few meters. In practical terms, if a human needs about 15–20 m head start to stop a world-class sprinter, an automated system might cut that down to ~10 m or even less, which could be the margin that protects high-security installations with compact layouts.
- Mechanical delays are the limiting factor: The time it takes for the physical barrier to close is often the largest single chunk of the timeline (sometimes >50% of total response time). If this mechanical closing time is long relative to the intruder’s travel time, the benefits of faster detection may be moot. Our delta analysis showed that in scenarios with very short distances or slow barriers, both human and automated responses fail. Therefore, focusing on speeding up the barrier mechanism (through engineering improvements or by increasing the distance at which it’s triggered) is as important as improving sensor or AI speed.
- Automation’s advantage can be erased by challenging conditions: The time delta remains meaningful only if the system is well-designed for the environment. High-end sensors and algorithms can falter in poor visibility, in cluttered scenes, or with complex backgrounds, potentially requiring more time or leading to missed detections. In such cases, the effective reaction time gap between human and machine closes or even reverses – humans can sometimes rely on intuition or contextual understanding that current AI lacks. Our Jensen’s alpha-style analysis captures this: in some scenarios, the automated system might not demonstrate a positive alpha (excess time-saving) once factors like low confidence or higher error rates force it to slow down or involve a human in the loop.
- Diminishing returns beyond a point: If an automated system is already, say, 0.5 s faster than a human, making it another 0.1 s faster may not yield a proportionate security benefit – especially if other factors like barrier speed or human oversight dominate the timeline. There’s a point at which further reduction in detection latency yields minimal practical improvement because the mechanical or human supervisory delays become the bottleneck. System designers should identify these limits and perhaps focus on the slowest stages (e.g., the barrier motion) once detection latency is below a certain threshold (for instance, well under the 0.1–0.2 s range).
- Scenarios where automation shines vs. struggles: Automation provides the greatest benefit in high-speed, clear-cut situations – e.g., a lone individual sprinting toward a checkpoint in good visibility. In these cases, the system’s rapid reaction can reliably add hundreds of milliseconds of safety margin. On the other hand, in a crowded entry checkpoint with lots of movement, the system might hesitate (to avoid false alarms) or could be intentionally fooled by a savvy attacker blending into a crowd. In those scenarios, layered security – including human judgment – remains vital. The automated system’s advantage is less about thinking and more about speed in unambiguous emergencies.
- Conditions where benefit disappears: Ultimately, if the time available is below roughly 0.5–0.7 s (depending on barrier specifics), even the fastest automated system cannot help – the physics of stopping a moving human body at such distances are unforgiving. Similarly, if the system’s accuracy forces it to be throttled (for example, requiring multiple frames to confirm a threat), the delay may reduce the advantage to nearly zero. Also, if false alarms (false positives) become too frequent, operators might effectively neutralize the system’s advantage by opting to leave the barrier open or taking it offline, eliminating the benefit of automation entirely. Proper tuning and scenario-specific calibration are necessary to preserve the gains in reaction time without introducing new risks.
In conclusion, our findings underscore that an automated checkpoint can significantly improve reaction time and safety margins, but only within a carefully engineered envelope. The technology can meaningfully increase the probability of stopping fast-moving threats in time, especially in the critical 5–15 m range that defeats human reflexes. Outside of that range, either the threat is too close for any reaction, or far enough that even a human can respond adequately (making automation less crucial). The next section will synthesize whether these improvements culminate in overall success and provide recommendations.
12. Conclusion
Our examination of “Human vs. Automated Checkpoint Reaction Advantage” finds that automated systems offer a measurable improvement in response time, often on the order of a few tenths of a second (e.g. 0.3–0.5 s faster than a human). In a footrace, a half-second is trivial; but in a security incident, a half-second can translate into several meters of an intruder’s travel – the difference between a sealed gate and a violent breach. Using world-record sprint speeds as a proxy for worst-case adversaries, we showed that a human guard might have essentially zero time margin at ~15 m and no chance below ~10 m, whereas an automated system could still effect a closure with time to spare at those distances. This positive time delta suggests a real tactical advantage to automation in high-threat scenarios.
However, this advantage exists only if the automated system is designed and managed properly. If mechanical closing hardware is too slow, or if the detection algorithm struggles under realistic conditions, the theoretical benefit evaporates. The “Jensen’s Alpha” analogy illustrated that an automated system needs to consistently beat baseline expectations (including accounting for environmental difficulty) to truly be considered a superior solution. A well-designed system in a controlled environment can have a positive alpha, indicating it adds protective value above the norm. But in poor conditions or without proper tuning, the same system might yield a zero or negative alpha, meaning no net gain in safety over simpler methods.
In summary, an automated checkpoint can produce a positive delta (time saved) and positive alpha (performance above expectation) relative to human response, particularly for extreme threats and short distances. The automation’s rapid reaction acts like a force multiplier for security personnel, giving them precious additional seconds (or fractions thereof) to neutralize a threat. Nonetheless, the success of such a system is not just a function of raw speed – it hinges on reliability, appropriate deployment distance, and integration with human decision-makers and safety protocols.
To maximize the benefits, we recommend:
- Invest in fast, reliable hardware: Use high-speed sensors (high FPS cameras or specialized motion detectors) and fast actuators (barriers that close in well under 1 s). The mechanical closing speed should be as short as possible to complement the faster detection.
- Optimize and test the AI: Ensure the detection algorithm is tuned for the environment (lighting, typical movement patterns) to keep inference times low and accuracy high. Use scenario-based training data including various environmental conditions to reduce sensitivity (β) to adverse factors.
- Layer and safeguard the system: Implement multi-layer security – e.g., a combination of human oversight and automated response. The automated system can act as a first line of defense, but a human should monitor and be able to intervene if needed (for example, aborting a closure if a false alarm is recognized). Build in failsafe modes that comply with safety regulations.
- Perform rigorous validation tests: A formal testing protocol is critical. This might involve using realistic dummies or volunteer runners at different speeds and distances, measuring the timing of both human and automated responses. Drills under various conditions (night vs day, cluttered backgrounds, multiple people running) will reveal how the system behaves. Only through such testing can stakeholders be convinced of the system’s real-world “alpha” – its ability to consistently outperform standard practice.
When kept non-lethal and implemented with attention to the above constraints, automated checkpoint closures represent a promising tool. They tilt the race in favor of the defenders, buying additional reaction time in situations where every millisecond counts. In a world where threats can emerge and escalate in the blink of an eye, harnessing the faster-than-human reflexes of machines – while maintaining human judgment in the loop – could significantly enhance security without compromising safety and ethics. The key is to ensure that the technology’s performance advantage remains robust under realistic conditions, thereby delivering a true excess value in safety (a positive “time-saving alpha”) and not just theoretical speed in a lab. With careful design, testing, and governance, automated reaction systems can indeed provide a critical edge in protecting secure facilities against high-speed intruders.
References:
[1] Guinness World Records. Fastest run 100 metres (male) – Usain Bolt, 9.58 seconds (record set 16 Aug 2009). URL: <https://www.guinnessworldrecords.com/world-records/fastest-run-100-metres-%28male%29>
[2] Wikipedia – “Christian Coleman.” Personal Bests section (World Record 60m in 6.34 s, set Feb 18, 2018). Available at: <https://en.wikipedia.org/wiki/Christian_Coleman>
[3] Wikipedia – “100 metres” (track event). Explains 100 m world record (Usain Bolt, 9.58 s) and the 0.100 s false start reaction time threshold in athletics. URL: <https://en.wikipedia.org/wiki/100_metres>
[4] Marathon Handbook (A. Sayer, 2026). “Average Human Sprint Speed: What To Track (And The Myth Of Peak Speed).” Provides data on typical sprint speeds for active and untrained adults (15–20 mph vs 12–15 mph). Retrieved Apr 24, 2026. URL: <https://marathonhandbook.com/average-human-sprint-speed/>
[5] ScienceInsights (2025). “What Is the Average Reaction Time of a Human?” Explains human reaction times: ~250 ms average for simple visual stimuli, 350–450 ms for choice tasks. URL: <https://scienceinsights.org/what-is-the-average-reaction-time-of-a-human/>
[6] ARCCA (2021). “Human Reaction Time in Emergency Situations.” Discusses simple reaction (~0.2 s) vs complex (multi-step) reaction times, noting ~1.5 s as a typical total brake reaction time under ideal driving conditions. URL: <https://arcca.com/blog/human-reaction-time-in-emergency-situations/>
[7] Turboo Turnstile (2025). “How Fast Is Fast Enough? Understanding Flap Barrier Speed.” Specifies that high-quality access control barriers generally open/close in 0.3 to 0.8 seconds, with some entry-level systems ~1.0 s. URL: <https://www.turbooturnstile.com/flap-barrier-speed/>
[8] Interesting Engineering (S. Sinha, 2026). “New autonomous car vision system is 4 times faster than human brain.” Notes that at 50 mph an automated vehicle took ~0.5 s to react to an obstacle, vs ~0.15 s for a human brain – highlighting the need for faster machine vision. URL: <https://interestingengineering.com/transportation/autonomous-car-vision-faster-than-human-brain>
[9] Wikipedia – “Jensen’s alpha.” Describes Jensen’s alpha as a measure of excess return above expected (risk-adjusted) return, with positive alpha indicating performance better than predicted by the model (CAPM). URL: <https://en.wikipedia.org/wiki/Jensen%27s_alpha>
Footer: Human vs. Automated Checkpoint Reaction Advantage | Page 1
