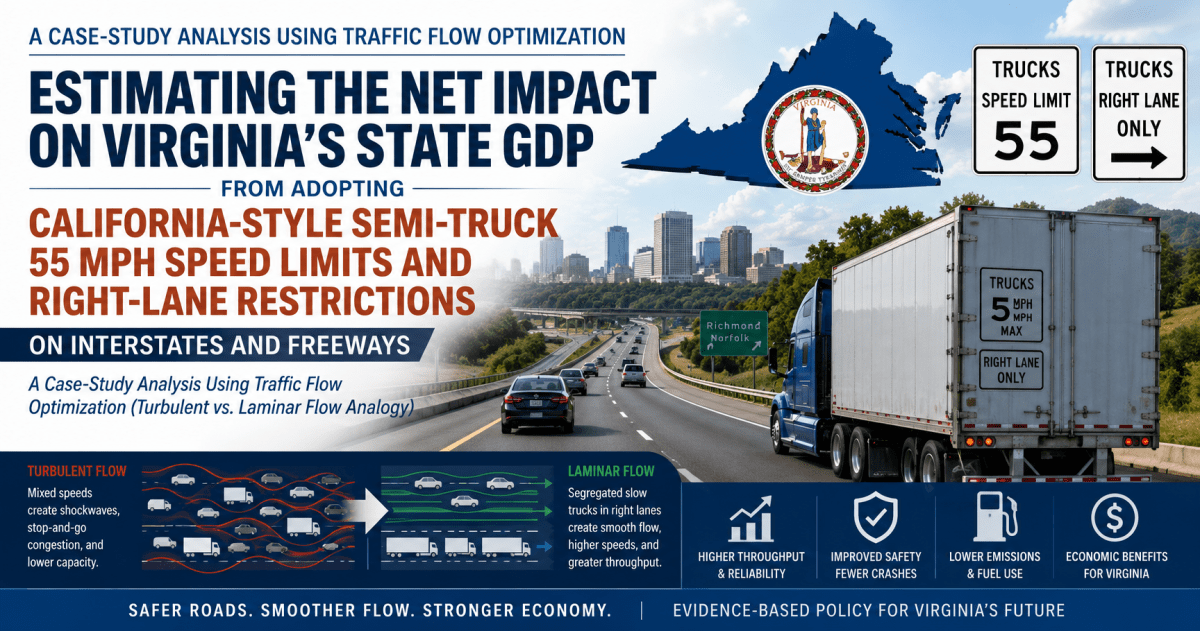
Executive Summary
California’s policy framework is clear and longstanding: trucks with three or more axles, and trucks towing another vehicle, are subject to a 55 mph maximum speed under California Vehicle Code §22406, and vehicles subject to that limit must use designated truck lanes or, where none are designated, the right-hand lane or the two rightmost lanes on wider freeways under §21655. California Highway Patrol guidance shows that commercial vehicles exceeding the posted limit by 15 mph or more face misdemeanor exposure, indicating that the policy is not merely symbolic but backed by specific enforcement rules. [1]
For Virginia, however, the most policy-relevant evidence does not support a confident claim that a California-style statewide regime would raise state GDP. California’s own recent research shows the core tradeoff clearly: higher truck speeds reduce travel time and operating costs but increase fuel use and safety costs; the converse is that a stricter 55 mph rule would likely improve some safety and fuel outcomes while lengthening truck travel time and raising logistics costs. The broader FHWA literature finds the safety effects of differential car/truck speed limits to be mixed or inconclusive, and Virginia’s own truck-lane-restriction evaluation found no statistically significant mobility improvement on high-volume multilane facilities and concluded that crashes were higher than expected after restrictions were introduced on those roads. [2]
Using Virginia-specific corridor data and a transparent case-study model, my central estimate is that a statewide California-style adoption would reduce Virginia gross state product by about $120 million per year, or roughly 0.015 percent of Virginia’s 2025 current-dollar GDP. A reasonable sensitivity range is approximately +$80 million to -$450 million annually, but the distribution is skewed negative because Virginia already has partial truck lane restrictions, because the Commonwealth’s closest empirical evidence on high-volume roads is unfavorable, and because a 55 mph cap would impose real transit-time penalties on high-volume freight corridors such as I-81 and I-95. The policy could produce localized benefits on selected rural, grade-heavy, access-light segments, but the case for a statewide rollout is weak. [3]
The policy recommendation is therefore not a statewide adoption. If Virginia wants to test the “laminar flow” hypothesis, it should use a targeted pilot on carefully selected rural corridors or work zones, with a sunset clause and a before-after evaluation focused on speed variance, lane-specific throughput, crash type, compliance, travel-time reliability, and shipper cost. [4]
| Policy Question | Would Virginia gain from adopting California-style 55 mph semi-truck limits and right-lane restrictions? |
|---|---|
| Central Estimate | -$120 million annually |
| Share of Virginia GDP | ≈ -0.015% |
| Sensitivity Range | +$80 million to -$450 million |
| Policy Finding | Do not adopt statewide. Use targeted rural pilots instead. |
Introduction
Virginia’s logistics economy is large enough that even small changes in truck operating conditions can matter economically. Virginia’s 2025 current-dollar GDP was about $798.4 billion. Transportation and warehousing contributed about $21.0 billion in 2024, and truck transportation alone contributed about $4.4 billion. Truck freight transportation accounts for roughly 7 percent of total vehicle miles traveled on Virginia public roads, and it is forecast to grow faster than passenger VMT over the long run. [5]
The Commonwealth’s interstate system is especially freight-intensive. VDOT identifies I-81 as Virginia’s most truck-intensive interstate corridor: the corridor carries about 1.4 billion truck VMT annually, accounts for about 43 percent of statewide interstate truck VMT, and moves $300+ billion in goods per year. A separate VDOT I-81 information board places the earlier corridor estimate at 11.7 million trucks per year and $312 billion in goods. On I-95, VDOT’s corridor plan reports about 9 million trucks per year and $195 billion in goods moving through the corridor, while Virginia’s rail expansion strategy is expected to remove 1 million trucks from Virginia highways each year once fully realized. [6]
Congestion costs in Virginia are also highly corridor-specific. VDOT’s incident-cost work found that lane-blocking incidents can be extremely expensive on major interstate corridors, with one-lane AM-peak blockage costs averaging $168 per incident-minute across districts and rising to $548 per minute in Northern Virginia; the cost of weekend peak lane-blocking incidents reached more than $1,200 per minute in the Fredericksburg district and more than $1,100 per minute in Northern Virginia. Those numbers explain why policymakers are interested in any operational strategy that might reduce shock waves, secondary crashes, or merge friction. [7]
The appeal of the California-style policy is intuitive. If heavy trucks are slower and more lane-disciplined, passenger traffic in the remaining lanes may become smoother and more predictable. But the same policy can also widen speed differentials, increase merging friction at ramps, and lengthen truck transit times. In a freight-heavy state like Virginia, the GDP question is therefore not whether the policy has some benefits; it is whether those benefits exceed the trucking-cost penalty at the statewide level. [8]
| Potential Benefit | Mechanism | Potential Cost | Mechanism |
|---|---|---|---|
| Lower crash severity | Lower truck speeds reduce kinetic energy | Longer freight travel times | 55 mph cap slows truck operating speed |
| Lower fuel use / emissions | Lower speed can reduce fuel burn per mile | Higher logistics costs | More truck-hours add labor and operating expense |
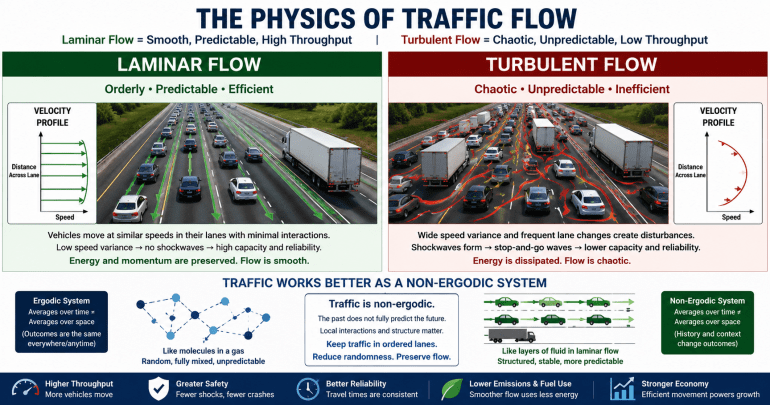
| Smoother left-lane flow | Truck segregation may reduce speed variance | Merge friction | Right-lane truck concentration can worsen ramp operations |
| Localized corridor gains | Works best on long, rural, access-light segments | Weak statewide case | Virginia evidence shows limited high-volume mobility gains |
| Metric | Reported Value | Policy Relevance |
|---|---|---|
| Virginia GDP | $798.4 billion | Baseline for measuring statewide GDP impact |
| Transportation & Warehousing GDP | $21.0 billion | Directly exposed sector |
| Truck Transportation GDP | $4.4 billion | Most directly affected subsector |
| I-81 truck VMT | 1.4 billion annually | Virginia’s most truck-intensive interstate corridor |
| I-81 share of statewide interstate truck VMT | 43% | Used to estimate statewide interstate truck VMT |
| I-95 truck volume | ≈ 9 million trucks/year | High-volume corridor with major freight exposure |
Case Study Methodology
This report uses a comparative case-study method. California is the primary case because it has operated the 55 mph truck speed ceiling and designated-lane regime for decades under codified rules. To assess transferability, I then use Oregon, Texas, Washington, and Virginia itself as analogs: Oregon because it retains differential speed policy and has evaluated speed-limit changes empirically; Texas because it has formal truck lane-restriction guidance and an empirical safety result; Washington because it combines a truck-specific interstate speed ceiling with left-lane restrictions; and Virginia because its own truck-lane experiments provide the closest institutional and geometric analogue. [9]
The Virginia GDP estimate below is intentionally transparent and modest in ambition. First, I estimate the lower-bound affected mileage using VDOT’s I-81 figures: if 1.4 billion truck VMT equals 43 percent of statewide interstate truck VMT, statewide interstate truck VMT is about 3.26 billion annually. That figure is conservative because the proposed policy would also apply to non-interstate freeways and highways, but interstate mileage is where the best Virginia corridor evidence exists. [10]
Second, I do not assume that a legal drop from current Virginia operating conditions to a posted/enforced 55 mph limit translates one-for-one into a 10–15 mph reduction in actual truck speed. The available evidence suggests actual operating-speed changes are smaller than posted-limit changes. A Caltrans literature scan reported that a 20 mph posted truck-speed range was associated with only about a 7 mph change in average truck speed, and FHWA’s differential-speed review found truck mean speeds in DSL states were often not significantly different from those in comparable USL states. For that reason, the scenario analysis uses an actual truck-speed reduction of 3 mph, 5 mph, and 7 mph rather than a mechanical full-limit adjustment. [11]
Third, I convert incremental truck-hours into cost using a representative heavy-truck value-of-time range grounded in state DOT practice summarized by VDOT. In VDOT’s congestion-cost report, Oregon’s closure-cost work used $33.24 per hour for heavy trucks, and Washington State DOT work used $57.40 per hour for trucks. I therefore use a central planning value of $45 per truck-hour, with lower and upper scenario values at $35 and $55. Because GDP is value added rather than total user cost, I then apply a stylized input-output-style pass-through to map net transport-cost changes into gross state product; this is a modeling assumption, not a published Virginia multiplier. [12]
| State | Policy Feature | Observed / Reported Lesson | Transferability to Virginia |
|---|---|---|---|
| California | 55 mph truck limit + right-lane regime | Clear legal structure; tradeoff between safety/fuel savings and travel-time costs | Useful legal model, but weak proof of statewide GDP benefit |
| Oregon | Differential truck speeds on many corridors | Higher speeds associated with higher crashes in evaluated corridors | Supports safety caution, not automatic GDP gain |
| Texas | Targeted truck lane restrictions | Positive results when applied under corridor-specific conditions | Strong support for targeted pilots |
| Washington | 60 mph truck cap + left-lane limits | Moderate differential-speed framework | Less restrictive than California; possible compromise model |
| Virginia | Existing truck lane restrictions | No statistically significant high-volume mobility improvement; crashes higher than expected | Major warning against statewide expansion |
California Rollout and Empirical Results
California’s legal architecture is straightforward. Vehicle Code §22406 sets a 55 mph maximum for motortrucks or truck tractors with three or more axles and for motortrucks or truck tractors towing another vehicle. Caltrans’ truck-lane guidance states that vehicles subject to §22406 must use designated lanes; where lane designation is not separately posted, those vehicles must operate in the right-hand lane, or in the two rightmost lanes on wider facilities. CHP’s highway-enforcement manual treats §22406 as an absolute speed law and notes misdemeanor treatment for commercial vehicles traveling 15 mph or more above the posted limit. [1]
What California’s recent evidence shows most clearly is the mobility-safety tradeoff, not a clean statewide capacity dividend from truck segregation. In the 2023 UC Davis/UC ITS study for California, simulation results showed that as speed limits rise, travel time falls but fuel consumption rises; safety costs also rise due to predicted increases in crashes, especially severe crashes. The same report found that raising rural California highway speed scenarios from the current differential baseline could reduce modeled operating costs by about 2 percent in a 70/60 scenario and about 5 percent in a 75/65 scenario, and it concluded that, within that model, operational savings could outweigh added crash costs on rural highways. Those findings are the strongest counter-evidence against a Virginia adoption of the California rule: if raising truck speeds in California lowers generalized costs, then lowering truck speeds in Virginia will likely do the opposite unless Virginia obtains a large offsetting throughput or safety gain. [13]
At the same time, California’s evidence does support two narrower points in favor of the policy logic. First, lower truck speeds are directionally consistent with lower fuel burn and lower kinetic energy in truck crashes. Second, California’s regime is coherent enough to support lane discipline and targeted enforcement. But the evidence reviewed for this report did not uncover a strong official California before-after study showing that the statewide 55 mph/right-lane package increased total freeway throughput in a way large enough to dominate the truck time penalty. That omission matters because the user’s hypothesis depends on a large “laminar-flow” gain. The California literature I found is stronger on safety and operating-cost tradeoffs than on a measured statewide capacity effect. [14]
The broader FHWA literature reinforces that caution. FHWA’s summaries conclude that the safety effects of differential speed limits are inconclusive overall; some studies find no difference, some favor one regime or the other, and some suggest that differential limits change crash composition more than overall rates. FHWA also notes that higher speed differentials can worsen rear-end severity, even where aggregate crash effects are mixed. [15]
Other States and Theoretical Framework
The transfer evidence from other states is mixed and highly conditional. Oregon still operates a differential-speed framework in which trucks remain at 55 mph on most interstates, while some interstate and rural highway segments now allow 65 for trucks and 70 for other vehicles. Oregon’s 2022 update on the 2016 Eastern Oregon speed-limit increases found that raised limits increased average speeds by about 3 mph and that interstate total crashes increased by about 10 percent after the speed changes; on rural two-lane highways with larger increases, the report estimated crash growth of nearly 50 percent. That evidence does not prove a 55 mph cap is economically optimal, but it does support the general safety proposition that higher speeds raise crash risk. [16]
Texas offers the strongest positive lane-restriction example in the material reviewed here, but it is narrower and more conditional than California’s statewide model. Texas guidance allows truck lane restrictions only under specific circumstances, and the Texas Transportation Institute’s Houston I-10 East Freeway evaluation reported a 7 percent crash-rate decline in the restricted area compared with a 3 percent increase on an adjacent unrestricted segment. Importantly, Texas’s own implementation guidance recommends restrictions only where truck exposure is high, the segment is at least 6 continuous miles, the restriction starts at least 1 mile beyond relevant ramps, and enforcement and signage are robust. In other words, even Texas treats lane segregation as a corridor design tool, not as a universal statewide rule. [17]
Washington’s legal structure is also more modest than the California concept. Washington caps trucks and vehicle combinations over 10,000 pounds at 60 mph and bars those vehicles from the left lane on limited-access roadways with three or more lanes in one direction. That is a meaningful differential-speed/keep-right regime, but it is not a California-style 55 mph statewide cap paired with right-lane confinement on all major high-speed roads. [18]
Virginia’s own evidence is the most important transfer test. The 2009 VTRC Phase II evaluation found that on high-volume interstates with three or more lanes in each direction, crashes were higher than expected after truck lane restrictions were introduced, and the researchers attributed this in part to more difficult merging. On those facilities, the study found no statistically significant mobility improvement; estimated travel speeds were only about 0.5 mph higher, and that result was not statistically significant. The same report recommended removing restrictions from high-volume three-lane facilities while retaining them on lower-volume roads, and it found only modest compliance gains from concentrated enforcement on two-lane-directional segments. That result is a major warning for any Virginia proposal that would go beyond the Commonwealth’s existing “no left-most lane” rules and move toward California’s much tighter lane confinement. [19]
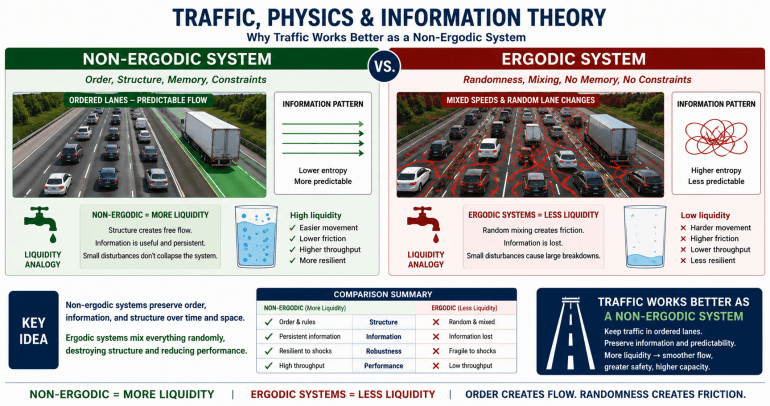
The “turbulent versus laminar flow” analogy is still useful, but only if applied carefully. FHWA explains that as freeway demand approaches capacity, traffic flow deteriorates into turbulence and shock waves; queues form when demand exceeds effective capacity, and shock waves propagate backward through traffic as abrupt transitions in speed, density, and flow. In that sense, the intuition behind separating slow heavy vehicles from faster passenger traffic is sound. [20]
Traffic-flow theory also explains why the benefits are conditional. FHWA’s capacity procedures reduce effective freeway capacity with a heavy-vehicle factor: . For urban freeways and rural freeways in level terrain, FHWA uses a heavy-vehicle passenger-car equivalent of about 1.5; ideal freeway capacity is typically around 2,250 to 2,400 passenger cars per hour per lane, and headways of 2, 3, and 4 seconds imply capacities of roughly 1,800, 1,200, and 900 vehicles per lane per hour. If trucks are moved out of the left lanes on long, access-light segments, those lanes can indeed operate more “laminarily.” But if the corridor is ramp-dense, if trucks are packed into the right lane near merges and exits, or if speed differentials become too large, the bottleneck merely migrates and new turbulence appears at merges and lane changes. That is exactly why Texas’s positive evidence is corridor-specific and why Virginia’s high-volume experience is cautionary. [21]
| Mixed-Speed “Turbulent” Flow | Policy Intervention | More “Laminar” Flow Goal |
|---|---|---|
|
Cars and trucks mix across lanes ↓ Higher speed variance ↓ Braking waves and lane changes ↓ Stop-and-go congestion |
55 mph truck cap + Right-lane restriction |
Trucks concentrated in right lanes ↓ Passenger lanes become more predictable ↓ Lower shockwave risk ↓ Potentially higher reliability |
| Key caution: The benefit depends on corridor design. If ramps are dense or truck volumes are heavy, the bottleneck may simply move to the right lane and merge areas. | ||
Virginia-Specific Analysis and GDP Estimation
The lower-bound mileage base for the Virginia estimate is statewide interstate truck VMT. Using VDOT’s current I-81 figures, statewide interstate truck VMT is roughly 3.26 billion miles per year. That is conservative because it excludes additional limited-access freeways and other high-speed highways that a California-style law would also touch. Virginia’s freight dependence is not abstract: I-81 alone carries about 43 percent of statewide interstate truck VMT, while I-95 carries about 9 million trucks per year. The sectors most exposed to such changes include transportation and warehousing directly, but also downstream retail trade and agriculture, which generated about $35.1 billion and $1.7 billion in real Virginia GDP in 2024, respectively. [22]
The key cost channel is truck time. The formula is simple:

where is current average operating speed and
is the post-policy operating speed. Using the conservative interstate-only mileage base, the resulting annual increase in truck-hours is material even when one assumes that actual operating speeds fall by less than the full legal differential.
| Scenario | Assumed actual drop in average truck operating speed | Incremental truck-hours per year | Gross truck time cost |
| Best case | 3 mph | about 2.9 million | about $100 million |
| Central case | 5 mph | about 4.8 million | about $215 million |
| Worst case | 7 mph | about 6.7 million | about $368 million |
These calculations use the lower-bound 3.26 billion interstate truck VMT estimate and truck-hour values of $35, $45, and $55 by scenario, consistent with the heavy-truck value-of-time range summarized by VDOT from Oregon and Washington practice. The table is an analytical calculation by this report using public-source inputs. [23]
Benefits exist, but they are likely smaller than the direct truck-time penalty in a statewide Virginia rollout. Lower truck speeds should reduce truck fuel use per mile at the margin; California’s recent work found that higher speed limits reduce travel time but increase fuel consumption, so the inverse effect is directionally supportive of some fuel and emissions savings. Passenger-car reliability can also improve on selected long rural segments if truck lane discipline materially reduces shock-wave formation. However, Virginia’s own multilane evidence suggests those gains are limited on high-volume corridors, and the Commonwealth has already captured part of the easy benefit through existing left-lane truck restrictions on I-81, Northern Virginia interstates, and other three-lane roads. [24]
My central statewide estimate therefore assumes: a 5 mph actual truck-speed reduction on the lower-bound affected mileage; roughly $215 million in gross annual truck time cost; a partial offset from fuel and emissions savings; only modest passenger-vehicle and reliability gains because Virginia’s own high-volume evidence is weak; and a small negative safety adjustment on metro corridors because larger speed differentials and merge friction can worsen rear-end and lane-change conditions. Converting the resulting net generalized transport-cost change into value added with a modest input-output-style pass-through yields a central GDP effect of about -$120 million annually, equivalent to roughly -0.015 percent of Virginia’s 2025 GDP. This should be interpreted as a case-study planning estimate, not a precise forecast. [25]
The scenario range is wide because roadway geometry matters enormously. In a narrow best case, if enforcement is excellent, if actual truck speeds fall only slightly, and if the policy is applied mostly where Texas-style conditions hold, the laminar-flow benefit could outweigh direct trucking losses, producing a GDP gain on the order of +$80 million. In a broad worst case, if the average truck-speed penalty approaches 7 mph on the full affected network and if Virginia’s adverse high-volume lane-restriction experience repeats on I-95, Northern Virginia, and other merge-dense urban corridors, the GDP loss could reach roughly -$450 million. The range is asymmetric because the direct freight penalty is certain, while the “laminar flow” dividend is conditional and site-specific. [26]
Environmental and equity effects do not reverse the central conclusion. Lower truck speeds likely reduce fuel burn and some emissions per mile, but longer trip times can intensify hours-of-service pressure, truck-parking demand, and schedule stress for drivers and small carriers. The distributional burden would fall most heavily on freight carriers, port drayage operators, agricultural shippers, and firms dependent on time-sensitive replenishment, while many of the passenger-car benefits would accrue to general traffic. In policy terms, that is a real transfer from freight-intensive businesses to motorists unless the operational benefits are large enough to offset it. Based on the evidence reviewed here, that offset is not persuasive at statewide scale. [27]
| Scenario | Assumed Actual Truck Speed Drop | Incremental Truck-Hours / Year | Gross Truck Time Cost |
|---|---|---|---|
| Best Case | 3 mph | ≈ 2.9 million | ≈ $100 million |
| Central Case | 5 mph | ≈ 4.8 million | ≈ $215 million |
| Worst Case | 7 mph | ≈ 6.7 million | ≈ $368 million |
| Scenario | Estimated Annual GDP Effect | Visual Scale | Interpretation |
|---|---|---|---|
| Best Case | +$80 million | ▲▲ | Targeted corridors work well; limited truck-speed penalty |
| Central Case | -$120 million | ▼▼▼ | Truck time cost exceeds modest flow and safety gains |
| Worst Case | -$450 million | ▼▼▼▼▼▼▼▼▼ | High freight delay, merge friction, and weak mobility gains |
Conclusion and Policy Recommendations
The strongest conclusion from this review is that the California-style concept is more defensible as a corridor treatment than as a statewide economic-development policy. California’s regime is coherent and enforceable, and traffic-flow theory does support the idea that reducing heavy-vehicle turbulence can help preserve smoother passenger flow. But Virginia’s closest empirical evidence does not show meaningful mobility gains on the very corridors where statewide GDP stakes are largest, and California’s own speed-limit research implies that lowering truck speeds will almost certainly raise trucking time costs. [28]
Accordingly, Virginia should not adopt a blanket California-style 55 mph/right-lane regime across all interstates and freeways. A more defensible policy would be a phased pilot limited to selected long rural segments—especially grade-heavy segments, work zones, or incident-prone sections where truck-climbing behavior and speed dispersion are already known problems—and even there the design should follow Texas-style criteria on segment length, ramp spacing, signage, and enforcement. The Commonwealth should explicitly exclude high-volume, merge-dense urban facilities from any initial rollout. [29]
Any pilot should be evaluated with a hard before-after design using lane-specific speed variance, travel-time reliability, queue duration, secondary crashes, truck compliance, shipper-reported cost, and corridor-level throughput. If the Commonwealth wants the economic benefits of smoother flow without a statewide truck-speed penalty, the higher-return alternatives are likely to be targeted truck-climbing lanes, incident management, rapid clearance, rail diversion where viable, and technology-assisted demand and lane management. Those options better match Virginia’s existing corridor programs on I-81 and I-95 and align more closely with the evidence base reviewed here. [30]
| Policy Option | Expected Economic Case | Risk Level | Recommendation |
|---|---|---|---|
| Statewide California-style 55 mph truck cap + right-lane rule | Weak; central GDP estimate is negative | High | Do not adopt statewide |
| Targeted rural pilot | Potentially positive on long, access-light, grade-heavy corridors | Moderate | Recommended |
| Urban / merge-dense restrictions | Unfavorable based on Virginia evidence | High | Avoid initial rollout |
| Alternative investments | Likely stronger return | Lower | Prioritize incident management, rail diversion, truck-climbing lanes, and lane-management technology |
Open questions and limitations
The main evidentiary gap is that I did not find a strong California before-after study isolating the statewide throughput effect of the full 55 mph/right-lane package. California’s evidence is much stronger on safety and operating-cost tradeoffs than on measured systemwide capacity gains. [31]
The Virginia GDP estimate is also conservative on mileage and approximate on multipliers. It uses interstate truck VMT as the core exposure base because that is where Virginia’s best public corridor data exist; the legislation described would reach additional freeways and highways as well. The GDP conversion is therefore best understood as a transparent planning approximation, not a substitute for a full Virginia-specific freight model or a proprietary shipper survey. [10]
References
California Legislature. California Vehicle Code §22406.
Caltrans. Truck Lane Use.
California Highway Patrol. Highway Patrol Manual 100.68, Chapter 3: Highway Enforcement.
California Highway Patrol. HOV and HOT Lane Information.
Musabbir, S. R., and Zhang, M. Assessing the Economic Impact of Speed Limit Changes on Safety and Mobility in California. UC ITS / ROSA P, 2023.
UC ITS. The Costs and Gains of Raising Truck Speed Limits. Policy brief, 2024.
FHWA. Safety Effects of Differential Speed Limits. FHWA-HRT-05-042, 2005.
FHWA. The Safety Impacts of Differential Speed Limits on Rural Interstate Highways. FHWA-HRT-04-156, 2004.
FHWA. Freeway Management and Operations Handbook.
FHWA. Recurring Traffic Bottlenecks, Fourth Edition, Appendix A.
FHWA. HPMS Field Manual, Appendix N: Procedures for Estimating Highway Capacity.
Lighthill, M. J., and Whitham, G. B. On Kinematic Waves II: A Theory of Traffic Flow on Long Crowded Roads. 1955.
Transportation Research Board. Traffic Flow Theory: A Monograph. Special Report 165, 1975.
Virginia Department of Transportation. About the Program: Improve 81. 2026.
Virginia Department of Transportation. I-81 Corridor Significance / Critical Transportation Corridor information boards.
Virginia Department of Transportation. I-95 Corridor Improvement Plan Final Report.
Virginia Transportation Research Council. Fontaine, Dougald, and Bhamidipati. Evaluation of Truck Lane Restrictions in Virginia: Phase II. VTRC 10-R12, 2009.
Virginia Transportation Research Council. Lan, Zhao, Goodall, and Gillespie. Cost of Congestion Due to Incidents on Freeways. VTRC 22-R15, 2021.
Virginia Transportation Research Council. Parambil. Increasing Regional Truck Freight Planning in Virginia. VTRC 25-R15, 2025.
U.S. Bureau of Economic Analysis / FRED. Gross Domestic Product: All Industry Total in Virginia; Transportation and Warehousing in Virginia; Truck Transportation in Virginia; Retail Trade in Virginia; Agriculture, Forestry, Fishing and Hunting in Virginia.
Texas Department of Transportation. Sign Guidelines and Applications Manual, Section 8: Restricted Truck Lanes.
Borchardt, Jasek, and Ballard. Guidelines for Vehicle Lane Restrictions in Texas. Texas Transportation Institute, 2005.
FHWA CMF Clearinghouse. Implement Truck Lane Restrictions; Evaluation of Truck Lane Restrictions in Virginia: Phase II.
Washington State Legislature. RCW 46.61.410, RCW 46.61.100, and WAC 468-510-020.
Oregon Department of Transportation. Speed Zone Manual. 2026.
Anderson, J. C., and Monsere, C. M. Updated Speed and Crash Analysis of Speed Limit Changes on Eastern Oregon Interstates and Highways. Oregon DOT / Portland State University, 2022.
[1] [9] https://leginfo.legislature.ca.gov/faces/codes_displaySection.xhtml?lawCode=VEH§ionNum=22406.
[2] [13] [14] [24] [27] [31] https://rosap.ntl.bts.gov/view/dot/68869/dot_68869_DS1.pdf
[3] [5] [25] https://fred.stlouisfed.org/series/VANGSP
https://fred.stlouisfed.org/series/VANGSP
[4] [26] [29] https://library.ctr.utexas.edu/hostedpdfs/tti/0-4761-s.pdf
[6] [10] [22] [23] https://improve81.vdot.virginia.gov/media/improve81/documentsacc/I-81-CIP-Info-Boards_Critical-Transportation-Corridor_acc10272025_PM.pdf
[7] [12] https://vdot.virginia.gov/vtrc/main/online_reports/pdf/22-R15.pdf
[8] [20] https://ops.fhwa.dot.gov/freewaymgmt/publications/frwy_mgmt_handbook/chapter1_02.htm
https://ops.fhwa.dot.gov/freewaymgmt/publications/frwy_mgmt_handbook/chapter1_02.htm
[11] https://dot.ca.gov/-/media/dot-media/programs/research-innovation-system-information/documents/preliminary-investigations/pi-0257-a11y.pdf
[15] https://www.fhwa.dot.gov/publications/research/safety/05042/chapt.cfm
https://www.fhwa.dot.gov/publications/research/safety/05042/chapt.cfm
[16] https://www.oregon.gov/odot/Engineering/Docs_TrafficEng/Speed-Zone-Manual.pdf
[17] https://www.txdot.gov/manuals/trf/smk/regulatory_signs/restricted_truck_lanes-i1020847.html
https://www.txdot.gov/manuals/trf/smk/regulatory_signs/restricted_truck_lanes-i1020847.html
[18] https://app.leg.wa.gov/rcw/default.aspx?cite=46.61.410
https://app.leg.wa.gov/rcw/default.aspx?cite=46.61.410
[19] https://cmfclearinghouse.fhwa.dot.gov/study_detail.php?stid=176
https://cmfclearinghouse.fhwa.dot.gov/study_detail.php?stid=176
[21] https://www.fhwa.dot.gov/ohim/hpmsmanl/appn1.cfm
https://www.fhwa.dot.gov/ohim/hpmsmanl/appn1.cfm
[28] https://dot.ca.gov/programs/traffic-operations/legal-truck-access/truck-lane-use
https://dot.ca.gov/programs/traffic-operations/legal-truck-access/truck-lane-use
