
Executive summary
Bottom line: in a mature steady-state, the physical-plate elimination channel is real but small: I estimate about $24 million per year in recurring Commonwealth/DMV resource savings, with a plausible range of $18–$32 million in 2026 dollars. The largest observed component is not metal plates but decal elimination: Virginia DMV’s 2025 study projects $1.13 million in annual mailing savings, $2.33 million in decal production/distribution savings, and roughly $10 million in indirect staffing-related savings from reduced service-center volume. Metal plate savings are modeled from Virginia’s statutory two-plate structure, VCE’s plate role, and external state unit-cost benchmarks because I did not find a public Virginia unit-cost schedule for metal plate manufacturing. [dmv.virginia.gov], [dmv.virginia.gov] [law.lis.virginia.gov], [govce.net], [app.leg.wa.gov], [utahnewsdispatch.com]
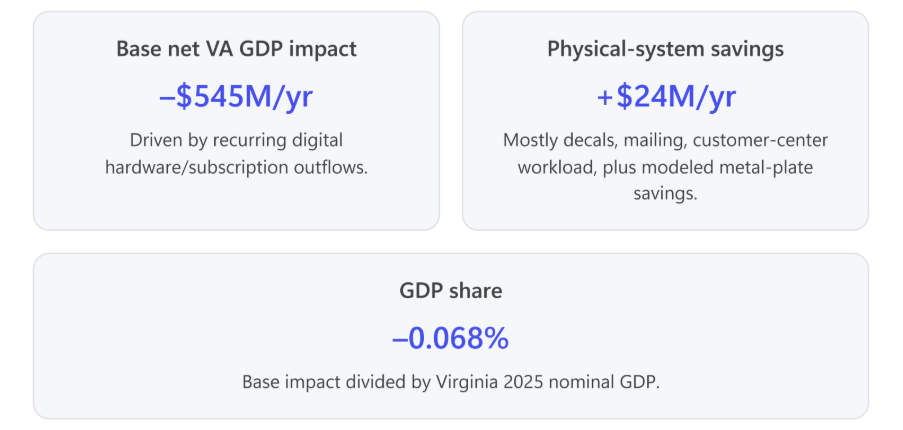
Economy-wide GDP result: under a current commercial-technology baseline, the net Virginia GDP effect is negative, because the new recurring digital-plate hardware/subscription channel is far larger than the avoided metal/decal process and most digital value would likely be produced outside Virginia unless the Commonwealth deliberately localizes assembly, support, software, or network operations. My base estimate is –$545 million per year, or –0.068% of Virginia’s 2025 nominal GDP; the sensitivity range is approximately +$2 million to –$2.34 billion per year. Virginia’s 2025 nominal GDP was $798.448 billion, and BEA/FRED reports Q1 2026 real Virginia GDP at $626.535 billion chained 2017 dollars. [fred.stlouisfed.org], [fred.stlouisfed.org]
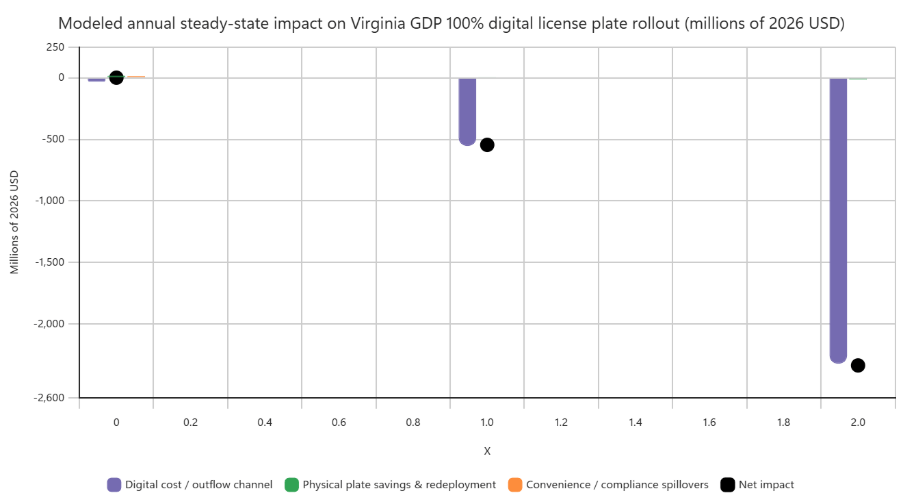
The chart below decomposes the modeled GDP result. The digital cost/outflow channel dominates because current Reviver pricing is $899 per RPLATE, with active service required and service tiers of $35, $75, and $125 per year; the current battery model is described as having up to four years of battery life. [reviver.com], [reviver.com]
The following flow map summarizes the mechanism: Virginia’s current plate system includes DMV/VCE, metal inputs, embossing/printing, inventory/mailing, and decals, while the digital steady-state substitutes connected devices, batteries, cellular/cloud services, cybersecurity oversight, and household payments. Those elements are grounded in Virginia’s license-plate statutes, VCE’s DMV partnership, Virginia DMV’s decal study, and Reviver’s published technology/pricing model. [law.lis.virginia.gov], [govce.net], [dmv.virginia.gov], [reviver.com]
Figure 1: Steady-state economic channels: physical-plate costs disappear, but connected-device hardware and subscription payments introduce a much larger recurring household and service-flow channel. The net Virginia GDP effect depends on how much of the new digital-plate value chain is produced inside Virginia.
1. Virginia baseline
Virginia’s latest FHWA state registration table reports 7,985,530 registered motor vehicles in 2024, consisting of 2,833,864 automobiles, 36,579 buses, 4,924,472 trucks, and 190,615 motorcycles. Virginia law requires one plate for registered mopeds, motorcycles, autocycles, tractor trucks, semitrailers, and trailers, and two plates for every other registered motor vehicle, except specified dealer/transporter plates; display rules similarly require front and rear plates for most vehicles, rear-only plates for motorcycles/trailers/semitrailers, and front-only plates for tractor trucks. [us-prod.as…rosoft.com] [law.lis.virginia.gov], [fhwa.dot.gov]
The DMV operating base is material but not huge relative to Virginia’s economy: the FY2026 Virginia Department of Motor Vehicles operating budget is $367.735 million with 2,225 positions. The Commonwealth Transportation Fund’s FY2026 budget includes $222.4 million in “Motor Vehicle Licenses” revenue and a $24.684 million distribution to DMV, while a 2026 fiscal note identifies the standard vehicle registration fee as $30.75 and allocates $4.51 of that to the Motor Vehicles Special Fund. [law.lis.virginia.gov]
Virginia’s plate production ecosystem is publicly identifiable but not fully cost-transparent. Virginia Correctional Enterprises says it partners with Virginia DMV on license and specialty plates, while VADOC’s FY2025 report describes VCE as the DOC “training and manufacturing arm,” with a $52.688 million VCE appropriation and 150 average employees; however, that VCE total covers all VCE operations, not license plates alone. Virginia DMV offers more than 200 special plates, and personalized plates cost $10 per year above registration and special-plate fees, which matters because digital messaging could substitute for some existing specialty/personalization workflows or revenue categories. [govce.net], [legiscan.com] [vadoc.es.v…rginia.gov]
2. Current physical plate cost structure and avoided-cost estimate
Observed Virginia costs
The best observed Virginia cost evidence is DMV’s 2025 decal-elimination study. DMV reports that more than 60,000 decals are reported lost or stolen annually, 660,911 vehicle registrations were renewed in person in FY2025, and eliminating decals could avoid more than half a million customer visits, equivalent to “almost 23,000 days” returned to Virginians using DMV’s wait/serve and drive-time assumptions. The same report says each decal costs $0.06, or $0.12 per pair, but DMV’s broader savings estimate is much larger: $1.13 million in annual mailing savings, $2.33 million in yearly decal production/distribution savings, and roughly $10 million in indirect staffing-related savings. [dmv.virginia.gov]
Modeled metal-plate costs
Because I did not find a public Virginia DMV/VCE per-plate manufacturing cost, I model the metal plate component from external state benchmarks. Washington DOC reported a license plate production cost of $2.76 per plate set versus $3.48 per plate set for an outside vendor, while Utah’s one-plate legislation was described as saving about $3.50 per license plate no longer printed and distributed. Reflective sheeting is a key cost driver: John R. Wald, a license-plate production supplier, states that reflective sheeting is the primary and most expensive component consumed in license plate production. [app.leg.wa.gov], [utahnewsdispatch.com] [dmv.virginia.gov]
Base annual avoided physical-system savings: $24 million.
| Cost component | Evidence status | Base estimate, $M/yr | Range, $M/yr |
| Decal mailing | Observed VA DMV | 1.13 | 1.1–1.2 |
| Decal production/distribution | Observed VA DMV | 2.33 | 2.2–2.5 |
| Indirect DMV service-center staffing/workload | Observed VA DMV estimate | 10.00 | 7–12 |
| Metal plate manufacturing, materials, logistics | Modeled from VA fleet + WA/UT benchmarks | 7.50 | 3–13 |
| Inventory, warehousing, equipment maintenance/depreciation | Modeled | 1.00 | 0.5–2 |
| Replacement, specialty/vanity fulfillment administration | Modeled | 2.00 | 1–3 |
| Total avoided physical process | Mixed | 24.0 | 18–32 |
GDP accounting caveat: cost savings are not automatically GDP gains. BEA defines industry value added as gross output minus intermediate inputs, and value added includes returns to labor, government, and capital; therefore, eliminating a Virginia production/admin activity can reduce measured Virginia GDP unless workers, facilities, and budget are redeployed to other Virginia output.
3. Digital plate steady-state cost model
Reviver’s current RPLATE is a connected, weatherproof digital plate priced at $899, with Bluetooth and LTE connectivity, an anti-theft bracket, a replaceable battery with up to four years of life, and an active service plan required for continued features such as customization and registration updates. Reviver’s service plans are Essential $35/year, Plus $75/year, and Premium $125/year, and Reviver states the service plan covers LTE/cellular connectivity, carrier relationships, connectivity with motor vehicle authorities, safety/security compliance, and platform costs. [reviver.com] [reviver.com]
California’s DMV pilot report is useful for feasibility, not cost savings: the Digital License Plate pilot grew to about 1,500 vehicles, DMV reported no significant DMV/law-enforcement/customer concerns, and DMV recommended permanent authorization; California also found that as optional products, consumer-borne costs had minor fiscal impact to the state. Arizona’s program evidence in the same report suggests state operating cost can be low under a vendor-managed model, but that does not make the consumer or state GDP burden low at 100% universal adoption. [bea.gov]
Base digital cost model, single-device architecture:
Formula:
Annual digital cost = vehicles × (hardware amortization + service plan + battery reserve) + DMV oversight
| Input | Base assumption | Source/logic |
| Registered vehicles | 7.9855M | FHWA 2024 Virginia total [us-prod.as…rosoft.com] |
| Devices per vehicle | 1.0 | Aligns with current rear digital plate deployments; current Reviver FAQ says one RPLATE is installed on the rear position. [reviver.com] |
| Hardware amortization | $899 ÷ 8 years = $112.38/yr | Retail price from Reviver; useful life modeled from prompt’s 5–10 year assumption. [reviver.com] |
| Service | $35/yr | Minimal Essential plan. [reviver.com] |
| Battery reserve | $39 ÷ 4 years = $9.75/yr | Reviver replacement battery price and stated battery life. [reviver.com] |
| Oversight/cyber/back-end DMV cost | $2M/yr | Modeled; California pilot staff cost was $39,693 for 1,130 hours, but that was a small optional pilot. [bea.gov] |
| Total base annual digital outlay | ~$1.256B/yr | Model output |
This is why the macro result changes sign. A $24M annual fiscal saving is overwhelmed by a $1.26B annual household/device-service channel unless the digital system is procured at a far lower cost, paid from productivity gains elsewhere, or localized inside Virginia.
4. Sectoral GDP decomposition
I use a comparative-static input-output sketch, not a purchased RIMS II table. BEA’s RIMS II system would be the preferred source for Virginia-specific multipliers; BEA says new RIMS II multipliers were released May 5, 2026, based on 2024 regional data and the 2017 national benchmark I-O table, and that RIMS II estimates effects on output, value added, earnings, and employment, but multipliers cost $520 per region or $160 per industry and were not publicly retrievable here. [dmv.ca.gov]
| Channel | Base VA GDP effect, $M/yr | Interpretation |
| Physical plate savings & redeployment | +4.6 | Nets $24M fiscal/resource savings against lost local plate/admin value added and assumes partial redeployment inside Virginia. |
| Digital hardware/subscription outflow | –554.2 | Assumes one device per vehicle, current low-tier pricing, 7% Virginia local value-added share, and lost local consumption from out-of-state payments. |
| Convenience/compliance spillovers | +5.0 | Monetizes DMV-documented time savings conservatively; broader law-enforcement/fleet/insurance gains are mostly unquantified. |
| Net VA GDP impact | –544.6 | Equivalent to about –0.068% of Virginia 2025 nominal GDP. |
The labor market effects are small in the physical-plate channel but potentially material in the digital service channel if localized. Virginia’s June 2026 nonfarm employment was 4.244 million, including 227,900 manufacturing jobs, 788,500 professional/business-services jobs, and 764,400 government jobs, so even a few dozen displaced plate-production/admin jobs would be macro-small, while a localized digital services/installation ecosystem could be visible but still modest relative to statewide employment. [apps.bea.gov]
5. Sensitivity analysis
| Scenario | Key assumptions | Net VA GDP impact, $M/yr | % of 2025 VA GDP |
| Optimistic | Bulk low-cost device/service model; one device per vehicle; 25% VA local digital value-added share; high redeployment of DMV savings | +1.5 | +0.0002% |
| Base | Current retail-like hardware amortized over 8 years; Essential service; one device per vehicle; 7% VA local share | –544.6 | –0.068% |
| Pessimistic | Two-device legal carryover for most vehicles; 5-year hardware life; Plus-like service; low VA local share | –2,337.5 | –0.293% |
The single biggest swing factor is not plate manufacturing savings; it is the number of connected devices and recurring subscription/service cost. Virginia’s current statute furnishes two plates for most vehicles, but current commercial digital-plate deployment is rear-only, so a legal/technical decision between “one connected digital display” and “two connected displays” changes annualized cost by billions in the pessimistic case. [law.lis.virginia.gov], [reviver.com]
6. Policy implications
- Do not justify universal digital plates on metal-plate savings alone. The physical-process savings are real but probably only $18–$32M/year, with the strongest Virginia evidence coming from decal elimination rather than metal-plate production. [dmv.virginia.gov]
- If Virginia wants a positive GDP result, localize the value chain. A statewide mandate would need Virginia-based assembly, refurbishment, battery logistics, customer support, cybersecurity operations, cloud/data operations, or installation networks; otherwise, household payments mostly leak out of state.
- Separate fiscal savings from welfare and GDP. DMV budget savings can improve fiscal capacity, but measured GDP can fall if Virginia production is displaced and consumer spending is redirected to out-of-state digital subscriptions.
- Avoid two-device architecture unless benefits are proven. Virginia’s two-plate law materially raises device count; if front digital plates are required, the GDP result becomes sharply more negative under current commercial prices. [law.lis.virginia.gov], [reviver.com]
- Pilot the economic model before the technology mandate. California found digital plates feasible and recommended permanent authorization, but its pilot was optional and consumer-paid, with minor state fiscal impact; it did not demonstrate a positive economy-wide GDP effect from universal adoption. [bea.gov]
Limitations and data gaps
The largest missing data point is Virginia-specific plate-unit production cost: I found public evidence that VCE partners with DMV on plate production, but not a public VCE/DMV cost table by standard plate, specialty plate, replacement, inventory, equipment depreciation, or labor hour. I also could not retrieve public Virginia RIMS II multipliers without purchase, so multiplier effects are modeled as ranges rather than treated as official BEA multipliers. [govce.net] [dmv.ca.gov]
The analysis excludes transition costs by design, consistent with your instruction. It also excludes advertising, data monetization, and privacy-sensitive data services from quantified GDP benefits because I did not find authoritative public evidence that such revenues would be legally available, material, or Virginia-local under a statewide rollout.
 Jarad Ponce