Executive summary — September 2, 2026
Tysons Galleria is not economically a 741,000-SF department-store mall; it is a 488,847-SF, luxury-dominated landlord rent roll supported by separately owned anchor pads.
Its 2025 in-line sales of $2,110/SF, approximately $44.3 million NOI, and 10.8% in-line occupancy cost demonstrate why sales productivity—not nominal occupancy or anchor count—is the defining fortress-mall metric.
The principal update to the original thesis is adverse but clarifying: Saks Fifth Avenue was selected for closure in March 2026, creating an actual co-tenancy test rather than a hypothetical risk; Neiman Marcus remained operating and held a Tysons hiring event on September 1, 2026.
1. Opening: A Mall Sector That No Longer Moves as One
The U.S. enclosed-mall market is bifurcated, not obsolete. Coresight’s April 2026 analysis found overall mall occupancy recovering from 85.0% in early 2022 to 90.7% by mid-2025, while top-tier operators reached 95.5% in 2025. Average top-tier rent rose to $68/SF versus $31/SF for the non-top-tier sample. New retail supply is exceptionally scarce: Cushman & Wakefield reported a Q2 2026 construction pipeline below 0.3% of inventory, with national shopping-center vacancy at 6.0% and asking rents up 2.2% year over year.
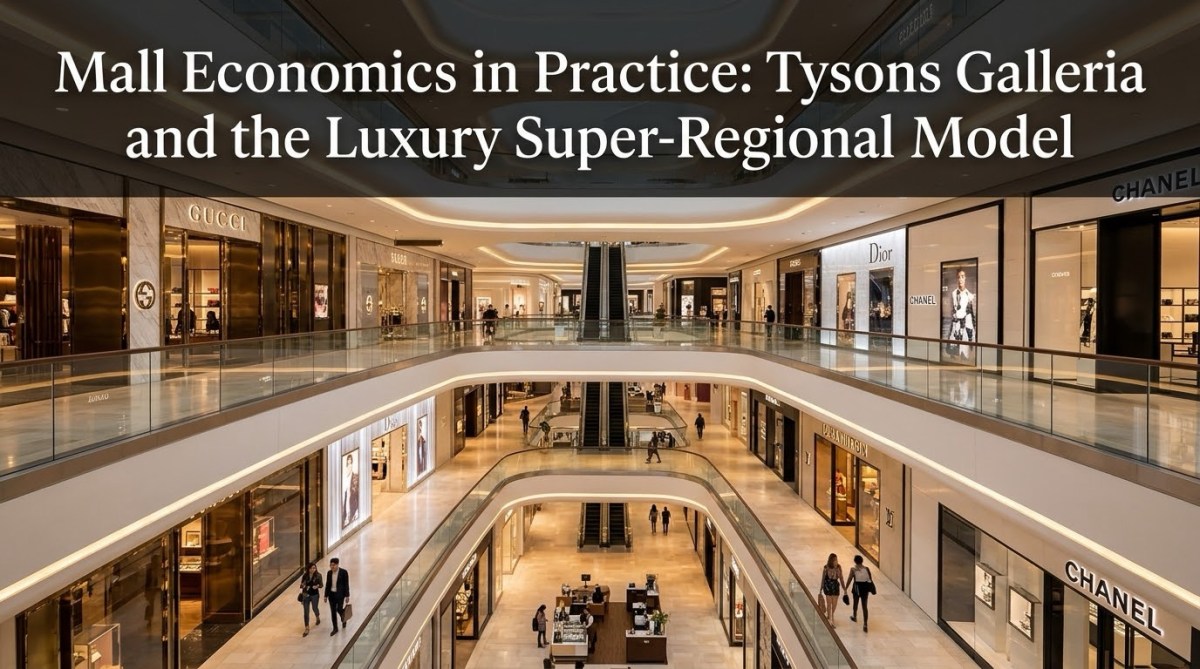
Tysons Galleria is an unusually clean specimen of the winning model. Opened in 1988 as the Galleria at Tysons II, it is a three-level enclosed center embedded in the Tysons II office-and-hotel complex. GGP/Brookfield describes more than 700,000 SF, 90-plus retailers, a 398-room Ritz-Carlton and five adjacent Class-A office towers.
The institutional number is more precise: S&P’s January 2026 presale uses 740,847 SF total GLA, of which only 488,847 SF is loan collateral because Neiman Marcus and Saks own their buildings and underlying land.
That distinction is the thesis. The center’s economic engine is a relatively compact landlord-controlled collection of luxury in-line stores, jewelry, home furnishings, restaurants and entertainment. The legacy department stores historically supplied identity, customer confidence and co-tenancy compliance—not meaningful rent.
Tysons Galleria is also distinct from Tysons Corner Center, approximately 0.5 miles away. Macerich’s property is a broader 1.918 million-SF super-regional center with Bloomingdale’s, Macy’s, Nordstrom, Primark, mass-to-premium retail and mixed-use additions. Macerich reported $1,200/SF sales and 96% leased occupancy in Q3 2023; its 2025 filing identifies a 50% legal interest in the property.
The centers overlap geographically but perform different jobs: Tysons I maximizes breadth and volume; the Galleria maximizes scarcity, luxury adjacencies and spend per visit.
2. How Enclosed Malls Make Money in 2026
The Revenue Stack
A mall lease begins with fixed minimum rent, usually quoted annually per occupied square foot. Above that sit:
- Percentage or overage rent: a share of sales above a contractual breakpoint.
- CAM and other recoveries: tenants’ allocated share of security, cleaning, common utilities, landscaping, maintenance and frequently management or administrative costs.
- Taxes and insurance: passed through separately or included in a broader gross-rent measure.
- Specialty leasing: kiosks, pop-ups, seasonal occupancies and temporary licenses.
- Ancillary income: media, sponsorship, parking, termination fees and event or promotional income.
Equation 1 — Natural Breakpoint
For example, if annual minimum rent is $500,000 and the percentage-rent rate is 5%, the natural breakpoint is:
In this example, percentage rent begins after the tenant’s applicable sales exceed $10 million, subject to the actual lease language.
ICSC notes that modern negotiations increasingly focus on whether online, pickup and other omnichannel transactions count as store sales, as well as on CAM exclusions, expense caps, radius restrictions and audit rights. Luxury maisons often support very high fixed rents because their stores are marketing and clienteling platforms as well as points of sale; percentage rent can consequently be less central than it is for a weak tenant placed on “percent in lieu” rent.
At Tysons Galleria, 2025 effective gross income was approximately $61.8 million: $31.7 million base rent, $14.4 million reimbursements, $11.0 million overage rent, $2.0 million percentage-in-lieu rent and roughly $2.8 million specialty/other income. After $17.6 million of property operating expenses, reported NOI was $44.3 million.
Equation 2 — Net Operating Income
The small difference versus reported NOI reflects rounding of the component figures. This illustrates why underwriting base rent alone substantially understates both mall income and volatility: more than half of effective revenue came from recoveries, sales-linked rent and other income.
Unit Economics
Leased occupancy counts executed leases, including unopened premises; physical occupancy counts stores actually operating. The Galleria’s 2021 redevelopment produced an extreme example: it was 92.6% leased but only 65.2% occupied because most former-Macy’s tenants were still under construction.
For year-end 2025, sources again conflict. S&P’s analysis indicates roughly 88.3% collateral occupancy, while CoStar reported 91.9% occupancy as of December 31; Commercial Property Executive described the property as “nearly 88% leased.” The likely issue is denominator, timing and whether non-collateral anchors or signed-but-not-open space are included. For lender economics, this note adopts 88.3% collateral occupancy, while retaining 91.9% as an owner/market-style measure requiring reconciliation.
Sales productivity is the cleaner health signal. In-line sales reached $2,110/SF in the trailing 12 months ended November 2025, versus $1,133/SF in 2019.
Equation 3 — Sales Productivity
Equation 4 — Occupancy Cost Ratio
In-line occupancy cost at Tysons Galleria fell from approximately 15.3% in 2019 to 10.8% in 2025. NOI rose from about $32.0 million in 2019 to $44.3 million in 2025, despite a modest decline from 2024 related partly to luxury relocations and construction disruption.
Valuation and CMBS
Mall value is principally stabilized NOI divided by a market capitalization rate, adjusted for leasing costs, capital requirements and redevelopment risk.
Equation 5 — Income-Capitalization Value
For illustration, $60 million of stabilized NOI capitalized at 6.0% implies:
The 2026 Tysons Galleria refinancing was a $435 million, five-year, fixed-rate, interest-only mortgage at an assumed 4.90%, maturing in March 2031. It refinanced the $425 million 2021 floating-rate loan. The appraisal was $1.0 billion, while S&P’s more conservative 6.25% capitalization approach produced a 63.4% stressed LTV and 1.99× debt-service coverage.
Equation 6 — Loan-to-Value
Equation 7 — Debt-Service Coverage Ratio
The non-owned anchor pads are excluded because the borrower cannot pledge real estate it does not own. This is why “mall size” is not synonymous with collateral, rentable area, rent-producing area or lender recovery value.
3. Anchors: Economic, Contractual and Psychological
A classic department store was simultaneously:
- An economic anchor generating visits and cross-shopping.
- A contractual anchor whose opening and continued operation satisfied co-tenancy definitions.
- A psychological anchor communicating that a property was stable, prestigious and worth a regional trip.
That package justified zero or nominal rent, owned pads, subsidized improvements and unusually broad operating rights. Modern luxury anchors increasingly provide brand halo and customer services rather than the bulk of traffic. Entertainment, fitness, home, restaurants and auto showrooms can create more frequent or longer visits—and usually pay materially more rent.
Neiman Marcus and the Former Saks Pad
S&P’s schedule assigns approximately 131,357 SF to Neiman Marcus and 120,643 SF to Saks, together 34% of total GLA but only around 1.6% of in-place gross rent. Neither reports reliable store sales publicly; historical sponsor estimates should not be treated as audited results.
The critical September 2026 update is that Saks Global’s March 6 closure list expressly included Tysons Galleria. Contemporary reporting said the store would operate through the end of May, while the current Galleria directory no longer lists Saks. Neiman Marcus remains listed and hosted a September 1 hiring event at the property. Accordingly, this analysis treats Saks as dark/closed and Neiman as the sole operating department-store anchor.
Reported Saks area is itself conflicted: the CMBS schedule uses 120,643 SF; a Fairfax zoning record describes an approximately 105,000-SF building; local reporting referred to a 41,399-SF storefront. The CMBS figure is most appropriate for total-GLA analysis, while the county figure may reflect usable building area under a particular land-use filing.
This matters because 18 tenant leases representing 26.6% of gross rent contained co-tenancy protections tied to anchor operation. Remedies may include reduced minimum rent, percentage-only rent or termination rights, depending on each lease. The risk is therefore vastly larger than the direct Saks rent loss.
A two-story Onelife Fitness reuse was explored, but the Fairfax County zoning interpretation record is now marked withdrawn. No replacement should be treated as committed as of this report date. A fitness use could supply repeat weekly traffic, but it would not automatically replace Saks’ luxury-signaling or satisfy each lease’s contractual replacement-anchor definition.
Macy’s as the Successful Precedent
GGP bought Macy’s 259,933-SF box and land for approximately $38 million in a 2016 sale-leaseback; Macy’s closed in 2019. Brookfield ultimately completed an approximately $110–$120 million conversion into a multi-tenant wing housing Crate & Barrel/CB2, RH, Arhaus, Lucid, Bowlero/Lucky Strike, CMX CinéBistro, Yard House and other uses.
By 2023 the redeveloped wing was effectively fully leased; by the 2026 CMBS underwriting its tenants produced roughly $100 million of annual sales and about $10 million of gross rent. That is the essential A-mall arbitrage: replace a low-rent department-store box with multiple rent-paying tenants while adding evening, home and entertainment demand.
4. Tenant Mix as Product Strategy
The useful taxonomy is: anchors above 50,000 SF; majors of 10,000–50,000 SF; in-line stores below 10,000 SF; then F&B, entertainment, wellness/services and temporary or popup uses.
- Luxury in-line and jewelry maximize rent and sales productivity.
- Majors provide selection and destination value at moderate rent.
- F&B captures additional occasions and evening traffic.
- Entertainment increases dwell time but normally does not lead sales/SF.
- Services and wellness create repeat visits less exposed to e-commerce.
- Popups test concepts and monetize otherwise idle space.
Tysons Galleria’s live directory contains more than 80 identifiable retail, dining and service entries, while Brookfield markets “90+ retailers” and S&P describes over 85 major, in-line, specialty and luxury tenants. These are not necessarily contradictions: directories may count restaurant stalls, hotel uses or temporary concepts differently from a CMBS rent roll.
The rent pool is concentrated in modest-size maisons. Bottega Veneta, Dior, Gucci, Louis Vuitton, Chanel and Cartier each represented roughly 2%–4% of in-place gross rent in the January 2026 schedule. Cartier has since reopened its remodeled boutique; Peter Millar opened its first Virginia store. S&P also underwrote Cartier’s doubling to approximately 12,000 SF and Louis Vuitton’s planned 7,000-SF expansion/two-level concept, together adding approximately $2.7 million of annual base rent when commenced.
Clustering works because each maison validates the location for the next. Customers can comparison-shop across brands; global leasing teams see proven luxury sales; and the Ritz-Carlton contributes internationally oriented hotel demand. Brookfield representatives said the Macy’s replacements exceeded initial sales expectations and specifically identified hotel guests as users of the entertainment and retail additions.
Inference: diplomatic, international-business and professional-services demand further enlarges the catchment beyond resident households, but no public source isolates its dollar contribution.
At $2,110/SF sales and 10.8% occupancy cost, a typical in-line tenant has room for rent growth while remaining near a low-to-mid-teens retail affordability range. At a $400–$600/SF mall, the same nominal rent increase would consume a far larger portion of store revenue. That denominator explains the sector’s bifurcation better than occupancy alone.
5. Trade Area, Access and Competition
Fairfax County had an estimated 1.168 million residents in July 2025, median household income of $153,637, 65% bachelor’s-degree attainment and a $732,800 median owner-occupied home value.
Macerich’s 2025 Tysons trade-area profile reports 721,836 residents in its primary trade area, $216,859 average household income, 72.7% bachelor’s-degree attainment and 62,847 employees within one mile of Tysons Corner Center.
Tysons itself supported an estimated 102,500 jobs in the county’s 2024 Tracker. The county’s long-range plan targets up to 100,000 residents and 200,000 employees by 2050; the jobs-to-household ratio improved from 11.7:1 in 2010 to 6.5:1 in 2024 as housing was added.
Four Silver Line stations, I-495, Routes 7 and 123, the Dulles corridor, office towers and hotel inventory widen the property’s demand periods—although arterial congestion and imperfect pedestrian connections remain genuine frictions.
The two Tysons malls are complementary because Tysons Corner Center absorbs mainstream apparel, consumer technology, family traffic and broader entertainment demand. The Galleria concentrates luxury, jewelry, designer fashion, home and a smaller high-spend audience.
The movement of Cheesecake Factory and Maggiano’s from Galleria to Tysons I underscores this sorting: broadly appealing, high-volume dining may fit the larger node better, while Galleria can reserve scarce frontage for higher-end or more differentiated concepts.
6. Risks, 24-Month Outlook and Transferable Lessons
Base case: Neiman remains open; luxury in-line sales stay strong; Saks remains dark while ownership and zoning options are evaluated. Occupancy temporarily reports below prior levels, but most direct rent is preserved because Saks produced little. NOI is flat to modestly lower before replacement rent, with co-tenancy settlements managed tenant by tenant.
Upside: a qualified replacement cures most co-tenancy provisions, divides or reuses the pad efficiently, and supports Cartier/Louis Vuitton-led rent growth. The Macy’s precedent shows that controlled-box redevelopment can materially increase rent generation—but Saks owns its real estate, reducing Brookfield’s control and potentially slowing execution.
Downside: Neiman also closes or materially weakens, the Saks pad remains dark, multiple luxury tenants invoke alternative-rent provisions, and consumer luxury spending slows. The combination—not Saks rent loss alone—is what could impair NOI, valuation and refinancing flexibility.
Nationally, the cushioning factors are tight supply and tenant preference for prime locations. The risk factors are concentration, expensive luxury-standard capital programs, anchor bankruptcy, interest-rate refinancing and continued change in Tysons’ office population. JLL reported malls returning to positive absorption in Q2 2026, while Coresight expects future NOI growth to come more from lease rollover and active tenant replacement than occupancy increases.
- Control dead boxes before they become bargaining chips.
- Underwrite sales/SF and occupancy cost, not just leased occupancy.
- Price anchor value as traffic, identity and contractual compliance—not rent.
- Treat tenant mix as product design, with explicit daypart and customer roles.
- Do not transplant the Galleria strategy to a weak B/C mall: most assets cannot recruit Chanel, Dior, Cartier and Louis Vuitton.
Appendix
A1. Asset Snapshot
| Metric | Current institutional reading |
|---|---|
| Address / opened | 2001 International Drive; 1988 |
| Format | Three-level enclosed luxury super-regional |
| Sponsor / manager | GGP, controlled by Brookfield; collateral includes fee and leasehold interests |
| Total / collateral GLA | 740,847 / 488,847 SF |
| Occupancy | 88.3% collateral; 91.9% alternate reported measure |
| 2025 in-line sales | $2,110/SF |
| In-line occupancy cost | 10.8% |
| Average base / gross rent | $85.18 / $137.71 per occupied collateral SF |
| 2025 NOI | $44.3M |
| Appraisal / loan | $1.0B / $435M |
| Loan | 4.90%, fixed, interest-only; March 2031 maturity |
A2. Anchor Schedule
| Anchor / box | SF | Ownership | Rent role | September 2026 status |
|---|---|---|---|---|
| Neiman Marcus | 131,357 | Tenant-owned building and land | Approximately 0.7%–1% of gross rent | Operating; Sept. 1 hiring event |
| Former Saks Fifth Avenue | 120,643 CMBS GLA | Saks-owned building and land | Approximately 0.9%–1% of gross rent | Closing announced for end-May; treated as dark |
| Former Macy’s redevelopment | ~237,000 building / ~195,000 retenantable program | Brookfield-controlled | Approximately $10M gross rent across multiple tenants | Operating multi-tenant wing |
A3. Illustrative Leading In-Line Rent Contributors
| Tenant | Approx. Jan. 2026 share of in-place gross rent | Strategic role |
|---|---|---|
| Bottega Veneta | 3.8% | Luxury fashion |
| Dior | 3.5% | Luxury fashion / Virginia scarcity |
| Crate & Barrel / CB2 | 3.1% | Major / home |
| Gucci | 2.9% | Luxury fashion |
| Louis Vuitton | 2.7% before planned expansion | Luxury cluster anchor |
| Chanel | 2.4% | Luxury cluster anchor |
| Cartier | 2.3% before expansion | Jewelry / watch productivity |
A4. Competitive Positioning
| Asset | GLA | Sales/SF / occupancy | Positioning |
|---|---|---|---|
| Tysons Galleria | 0.741M | $2,110 / 88.3% collateral, 2025 | Concentrated luxury |
| Tysons Corner Center | 1.918M | $1,200 / 96%, Q3 2023 | Broad super-regional |
| Fashion Centre at Pentagon City | 0.866M | $850 / 91%, 2021 appraisal | Tourism, transit, fashion |
| Westfield Montgomery | 1.330M | $785 / 70%, 2021 appraisal | Affluent regional |
| Fair Oaks Mall | 1.550M | $650 / 94%, 2021 appraisal | Mainstream suburban |
| Dulles Town Center | 1.407M | $300 / 91%, 2021 appraisal | Lower productivity / redevelopment risk |
Note: Older competitor figures are historical positioning benchmarks, not current estimates.
A5. Co-Tenancy Sensitivity
| Scenario | Anchor condition | Illustrative gross-rent sensitivity | NOI direction |
|---|---|---|---|
| Upside | Qualified replacement / cure | 0%–20% of exposed pool | Flat to positive |
| Base | Saks dark; selective negotiated relief | 20%–40% of exposed pool | Modest decline |
| Downside | Prolonged dark plus Neiman impairment | 50%–100% of exposed pool | Material decline |
S&P identifies 26.6% of in-place gross rent as contractually exposed. Applying that percentage to the reported rent base implies an order-of-magnitude exposed pool of approximately $16 million annually. The scenario percentages are arithmetic sensitivities, not forecasts, and actual remedies differ by lease.
Equation 8 — Co-Tenancy Exposure
This does not mean $16 million of rent is automatically lost. It identifies the approximate rent pool associated with leases containing relevant co-tenancy protections. Actual economic loss depends on each lease’s remedy, cure provisions, alternative-rent formula and tenant behavior.
If You Remember Nothing Else
- Tysons Galleria’s real economic footprint is 488,847 collateral SF, not headline 741,000 SF.
- $2,110/SF sales and 10.8% occupancy cost explain its pricing power better than occupancy.
- Neiman and the former Saks pad are roughly one-third of GLA but only about 1.6% of rent.
- Saks’ 2026 closure matters through co-tenancy and identity, not direct lost rent.
- The Macy’s conversion proves the A-mall opportunity—but luxury density and Fairfax/NoVA demand make this an outlier, not a universal redevelopment template.
Key Equations at a Glance
Natural Breakpoint
Natural Breakpoint = Annual Minimum Rent ÷ Percentage-Rent Rate
Net Operating Income
NOI = Effective Gross Income − Property Operating Expenses
Sales Productivity
Sales/SF = Tenant Sales ÷ Selling Area
Occupancy Cost Ratio
Occupancy Cost Ratio = (Rent + Reimbursements) ÷ Tenant Sales
Income-Capitalization Value
Property Value = Stabilized NOI ÷ Capitalization Rate
Loan-to-Value
LTV = Loan Balance ÷ Property Value
Debt-Service Coverage Ratio
DSCR = Underwritten NOI ÷ Annual Debt Service
Co-Tenancy Exposure
Exposed Rent = Total In-Place Gross Rent × Co-Tenancy Exposure %

