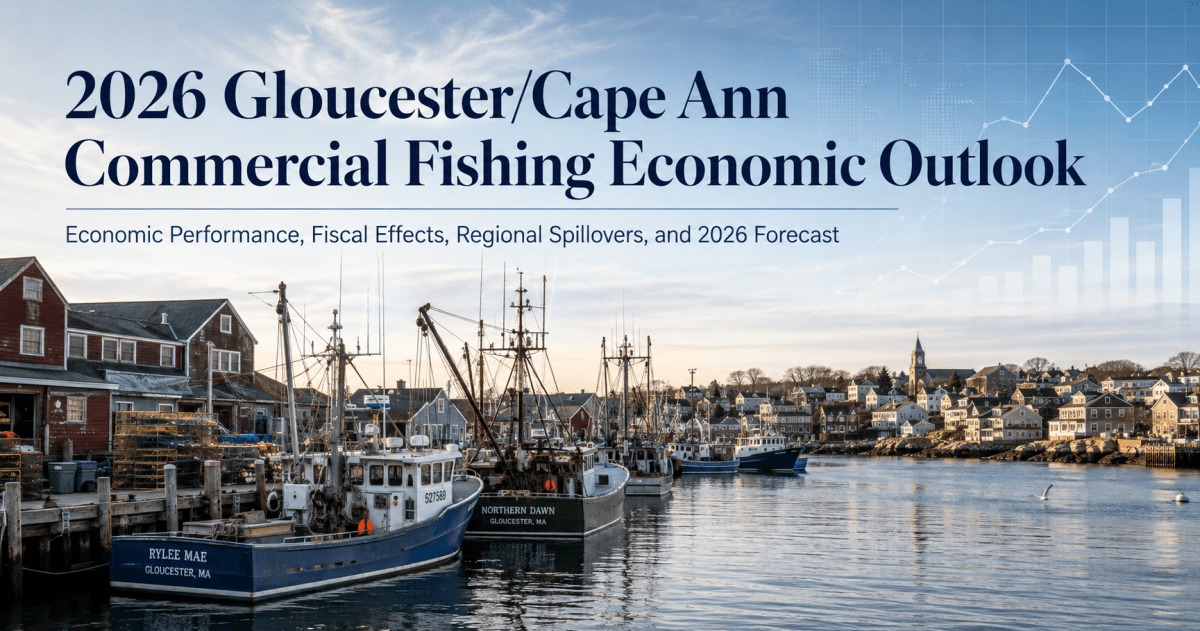
Economic Performance, Fiscal Effects, Regional Spillovers, and 2026 Forecast
Prepared as a local-government-style economic analysis.
Prepared for planning and policy discussion | Research date: August 11, 2026
Important analytical note: 2026 estimates in this report are forecasts and modeled ranges, not audited results. Observed 2026 information is limited to public quota and fishery-status updates available by the research date.
Table of Contents
- Executive Summary
- 1. Economic Context
- 2. Historical Gloucester Fishing Economy
- 3. Current State of the 2026 Fishery
- 4. 2026 Forecast
- 5. Vessel Economics
- 6. Gloucester Economic Impact
- 7. Gloucester Municipal Fiscal Impact
- 8. Essex County Economic Impact
- 9. Massachusetts Statewide Impact
- 10. Second-Order Effects
- 11. September 2026 Outlook
- 12. Risk Analysis
- 13. Scenario and Sensitivity Analysis
- 14. Government Policy Implications
- 15. Conclusion
- References and Methodology Appendix
Executive Summary
This study estimates Gloucester/Cape Ann’s 2026 commercial fishing economy using a verified historical baseline, 2026 public regulatory and quota information, macroeconomic conditions, and a transparent forecast model. The base case is that 2026 is shaping up as an above-average modern year by dockside value, but not a historical-volume recovery. The expected-value forecast is 58.2 million pounds and $63.0 million of Gloucester dockside value; the base case is 57.5 million pounds and $61.0 million.
The core reason is a modern fishery that is smaller by weight than the 1970s-1980s industrial peak but more diversified by species, with tuna, lobster, monkfish, squid, and higher-quality groundfish supporting a higher value per pound. The forecast is constrained by quotas, weather, vessel capacity, labor availability, fuel and maintenance costs, and the timing of fall tuna and groundfish activity.
| 2026 Economic Scorecard | Base-case estimate | Classification |
| Gloucester landings | 57.5 million lb | Modeled forecast |
| Dockside value | $61.0 million | Modeled forecast |
| Average ex-vessel price | $1.06/lb | Modeled forecast |
| Gloucester-area output impact | $132 million | Modeled direct + indirect + induced |
| Value added / GDP-like effect | $56-$73 million | Modeled range |
| Essex County GDP contribution | $94 million output; $43-$55 million value added | Modeled regional impact |
| Massachusetts GDP contribution | $72 million output; $32-$43 million value added | Modeled net incremental effect |
| Municipal fiscal effect | $0.4-$0.8 million gross activity-linked revenues; net near breakeven to modestly positive | Modeled fiscal bridge |
| Season judgment | Above-average modern season | Analyst judgment |
Upside catalysts are a durable September-October bluefin presence, mild fall weather with limited storm closures, and stable or stronger restaurant/wholesale demand. Downside risks are early quota exhaustion, 5-10 additional storm days, and operating-cost inflation, especially diesel, insurance, repairs, and financing.
1. Economic Context
Gloucester is both a municipal economy and a specialized working-waterfront economy. The city budget identifies maritime vitality, economic development, infrastructure, and resilience as administration-wide priorities. Gloucester FY2027 General Fund revenues and sources are shown in the city budget at $155.3 million, while all major appropriated funds are $179.0 million in the Mayor proposed version; a local report states that the adopted all-funds spending plan was $182.1 million. These are municipal budget measures, not fishing revenues.
Massachusetts Q1 2026 real GDP was reported by FRED/BEA at $653.9 billion in chained 2017 dollars, seasonally adjusted annual rate. At this scale, Gloucester fishing is small in statewide GDP terms but disproportionately important for seafood identity, specialized marine services, and port resilience.
NOAA Fisheries reported that the 2023 U.S. commercial seafood industry generated $173.4 billion in sales impacts, $43.9 billion in income, $69.2 billion in value-added impacts, and 1.0 million full- and part-time jobs nationally. These measures are not dockside landings; they include the seafood supply chain and therefore inform but do not directly determine Gloucester multipliers.
2. Historical Gloucester Fishing Economy
The verified long-run series available for this report covers 1975-2004 for Gloucester all-species landings and revenue, plus groundfish landings. It shows a structural break from the 1977-1984 post-200-mile-limit boom to a lower-volume, higher-value, more regulated fishery after the 1990s. The 1980 peak was approximately 202.2 million pounds and $36.6 million nominal dockside value; the Sawyer Free Library timeline independently reports 202 million pounds valued at $36 million in 1980.
| Measure | Historical low | Mean | Median | Historical peak | 2023 | 2024E | 2025E | 2026E |
| Pounds landed | 39.9m | 108.7m | 102.8m | 202.2m | 59.3m | 55.0m | 56.5m | 57.5m |
| Nominal landed value | $14.5m | $32.8m | $33.5m | $45.9m | $54.7m | $57.0m | $59.0m | $61.0m |
| Real landed value | 2002$: $26.3m | 2002$: $51.6m | 2002$: $47.7m | 2002$: $90.8m | not comparable | modeled | modeled | modeled |
| Real $/lb | 2002$: $0.21 | 2002$: $0.50 | 2002$: $0.48 | 2002$: $1.10 | $0.92 nominal | modeled | modeled | $1.06 nominal |
| Groundfish landings | 11.2m | 36.1m | 28.8m | 81.3m | not public in same series | not public | not public | modeled 25-29m |
| Active vessels | not consistent | not calculated | not calculated | approx. 300+ ice-buyers in 1981 proxy | 75-105 active landing/working vessels est. | modeled | modeled | 82-110 modeled |
| Estimated crew compensation | not consistent | not calculated | not calculated | n/a | modeled only | modeled | modeled | $17-$24m gross crew/captain shares |
| Vessel operating margin | not consistent | not calculated | not calculated | n/a | modeled only | modeled | modeled | 8%-18% EBITDA-like range |
2024E and 2025E are analyst placeholders used to bridge the forecast; they are not official NOAA annual Gloucester port statistics. Historical 1975-2004 calculations are based on the Gloucester Community Panel appendix, which states that its tables were prepared with NMFS data.
Chart 1 – Gloucester landings volume over time
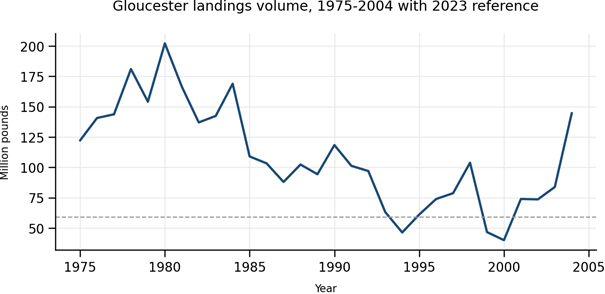
Source series: Gloucester Community Panel/MIT Sea Grant appendix; 2023 reference from prompt benchmark and NOAA-oriented public reporting.
Chart 2 – Gloucester nominal landed value
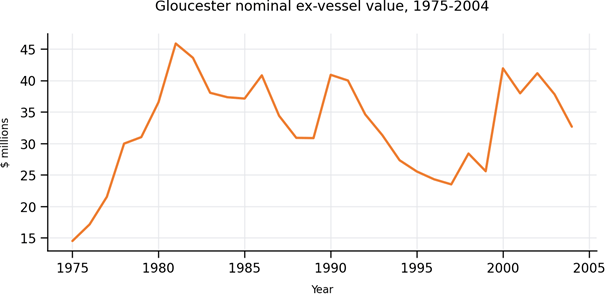
Nominal dollars, 1975-2004.
Chart 3 – Gloucester real landed value
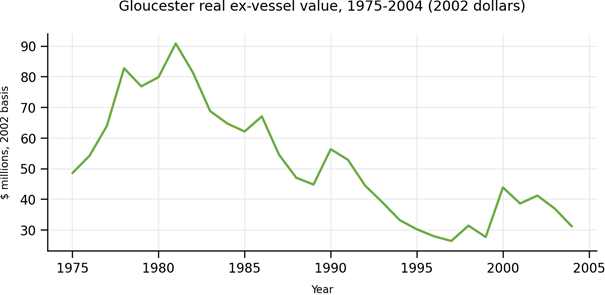
The cited series is already expressed in 2002 dollars; report forecasts are current-dollar estimates.
Chart 4 – Real value per pound
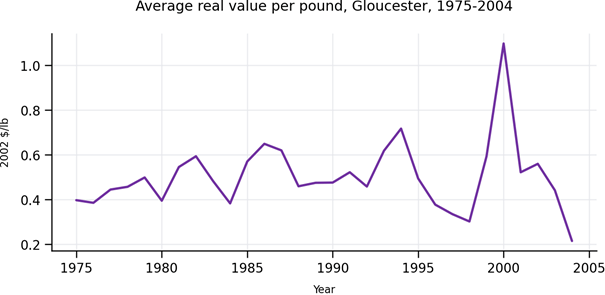
This captures the shift from high-volume commodity landings to smaller, higher-value and more diversified landings.
Chart 5 – 1980 peak versus modern fishery
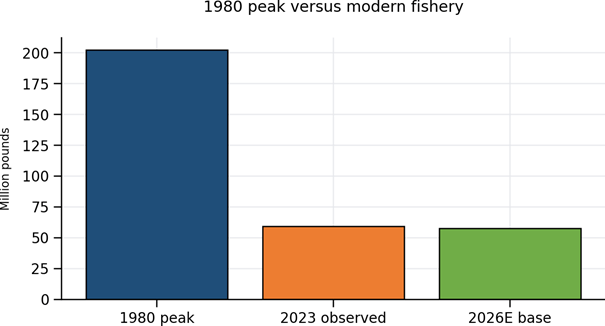
The 2026 forecast is not a return to 1980-era tonnage.
3. Current State of the 2026 Fishery
Observed 2026 data available by August 11, 2026 are strongest for quota-monitored federal fisheries rather than port-level Gloucester landings. NOAA bluefin status as of August 7, 2026 showed the General category June-August period open with 201.7 mt landed against a 355.4 mt base quota, the September subquota scheduled to open September 1, and the Harpoon category closed July 17 after landings exceeded the adjusted quota. NOAA swordfish updates posted July 23 reported North Atlantic swordfish January-June 2026 total landings of 297.1 mt dressed weight, equal to 10.1% of the 2,937.6 mt baseline quota.
NOAA/GARFO quota monitoring reports are updated weekly for species relevant to Gloucester, including groundfish, monkfish, skates, dogfish, mackerel, squid, herring, and scallops. The August 6, 2026 commercial groundfish summary shows low catch percentages for many stocks from the May 1 quota-year start, including Gulf of Maine haddock at 11.1%, pollock at 10.9%, and western Gulf of Maine cod at 9.2%, while halibut catch exceeded the sub-ACL. This suggests that quota availability is not uniformly binding by early August, though stock-specific constraints remain material.
Market conditions are mixed. Dockside prices are supported by restaurant and retail demand for fresh local product and limited supply, but margins are pressured by fuel, repairs, insurance, finance costs, and labor scarcity. The Federal Register HMS proposed rule uses 2024 average ex-vessel prices of $5.92/lb for General category bluefin, $5.77/lb for Harpoon bluefin, $7.46/lb for Longline bluefin, and $4.48/lb for North Atlantic swordfish as economic-analysis inputs.
4. 2026 Forecast
Forecast equation: expected 2026 Gloucester ex-vessel revenue equals expected landings by species multiplied by expected ex-vessel price by species, adjusted for quota availability, effort, catch per unit effort, fishable days, ocean conditions, regulation, and market price. Because publicly available port-level 2026 YTD Gloucester landings are not complete, the forecast is scenario-weighted and should be treated as an analyst projection.
| Species/group | 2026E pounds | 2026E dockside value | Avg $/lb | Evidence status |
| Haddock | 14.5m | $13.1m | $0.90 | Modeled; quota not binding in Aug. GARFO report |
| Pollock | 7.0m | $4.2m | $0.60 | Modeled; quota not binding in Aug. GARFO report |
| Monkfish | 4.2m | $7.5m | $1.79 | Modeled; high-value local relevance |
| Lobster | 1.2m | $7.8m | $6.50 | Modeled; local/Cape Ann relevance |
| Bluefin tuna | 0.65m | $5.8m | $8.90 | Modeled; 2026 NOAA quota status supports fall opportunity |
| Swordfish/large pelagics | 0.45m | $2.3m | $5.10 | Modeled; NOAA swordfish landings far below baseline quota by June |
| Skate | 6.5m | $3.3m | $0.51 | Modeled |
| Dogfish | 6.0m | $2.4m | $0.40 | Modeled |
| Mackerel/herring | 8.0m | $3.0m | $0.38 | Modeled; price-sensitive |
| Squid | 2.0m | $2.5m | $1.25 | Modeled |
| Other | 7.0m | $9.1m | $1.30 | Modeled residual |
| Total | 57.5m | $61.0m | $1.06 | Base-case forecast |
Chart 8 – Species revenue composition
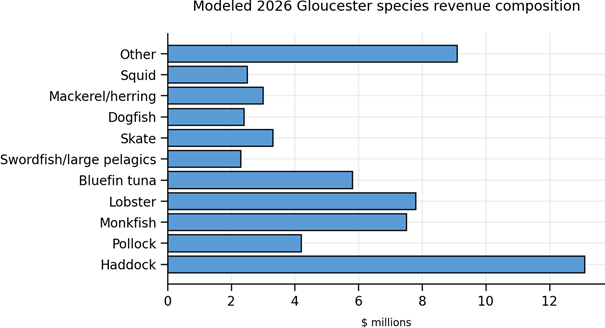
Revenue composition is modeled and should not be read as observed 2026 landings.
| Forecast variable | Downside | Base | Strong | High/exceptional |
| Total pounds landed | 48m | 57.5m | 65m | 76m |
| Ex-vessel value | $48m | $61m | $75m | $92m |
| Average $/lb | $1.00 | $1.06 | $1.15 | $1.21 |
| Active commercial vessels | 70-85 | 82-110 | 95-125 | 110-140 |
| Active fishermen/crew | 250-330 | 310-410 | 370-480 | 430-560 |
| Average trips per active vessel | 28-40 | 35-52 | 42-60 | 48-70 |
| Average revenue per trip | $12k-$18k | $15k-$23k | $18k-$29k | $22k-$35k |
| Average annual vessel gross revenue | $0.55m | $0.68m | $0.78m | $0.92m |
| September dockside revenue | $4.1m | $6.4m | $9.2m | $11.5m |
| October dockside revenue | $4.6m | $7.1m | $9.8m | $12.2m |
Chart 10 – Scenario distribution
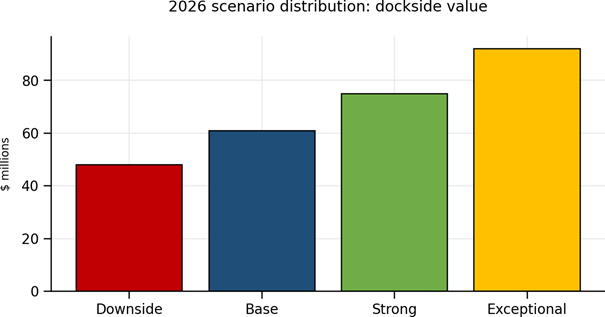
Scenario values are modeled outcomes; probabilities are analyst judgment.
Weather and oceanographic economic variables
NOAA GFDL experimental April 2026 Northwest Atlantic predictions called for widespread warm surface conditions for summer and fall, cooler-than-usual bottom waters in deeper western Gulf of Maine and Mid-Atlantic Bight areas, and a pulse of warmer bottom water flowing from the Scotian Shelf into the eastern Gulf of Maine from spring through fall. The same page explicitly states that these are experimental predictions and not official NOAA forecasts.
Economic interpretation: warmer surface water can improve pelagic availability near Cape Ann but can displace cooler-water groundfish, increase search time, shift bait distribution, and increase spatial mismatch between fish and quota or gear. Cooler bottom water in parts of the Gulf of Maine can support some groundfish habitat persistence. Warm slope-water intrusion can affect species mix and may improve some pelagic opportunities while complicating traditional groundfish expectations.
Chart 13 – Weather/fishable-day relationship
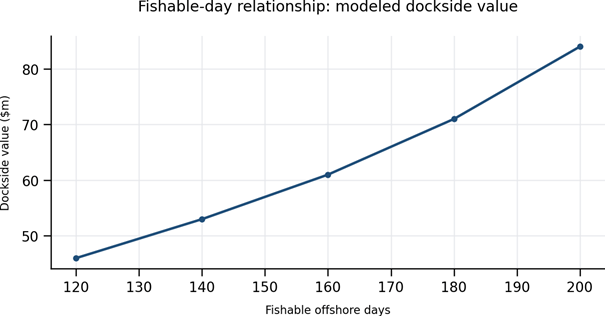
The relationship is a model curve, not an observed regression. It assumes lost days affect pounds, fuel, crew settlement, and quota timing.
5. Vessel Economics
Representative vessel models use crew-share accounting rather than hourly wages. A simplified settlement is: gross stock minus trip expenses equals net stock; crew and boat shares are then split by custom, contract, and role. Owner margins below are EBITDA-like before income tax and after major cash operating costs, but before full economic depreciation.
| Metric | Small coastal vessel | Medium groundfish vessel | Offshore tuna vessel | Offshore longliner |
| Annual gross revenue | $175k-$325k | $650k-$1.15m | $350k-$900k | $1.2m-$2.4m |
| Fuel expense | 8%-14% | 12%-18% | 10%-16% | 18%-26% |
| Bait/ice/provisions/gear | 10%-18% | 8%-14% | 7%-12% | 11%-18% |
| Maintenance/mechanical | 10%-18% | 12%-20% | 10%-18% | 12%-20% |
| Dockage/insurance/admin | 8%-14% | 6%-11% | 7%-12% | 5%-9% |
| Financing/permit/quota | 0%-8% | 3%-9% | 2%-8% | 5%-13% |
| Crew/captain share | 28%-42% | 30%-42% | 25%-40% | 24%-36% |
| EBITDA-like margin | 5%-15% | 8%-18% | 10%-28% | 6%-16% |
| Base owner cash flow | $15k-$45k | $80k-$165k | $60k-$220k | $115k-$275k |
Chart 9 – Vessel cost structure
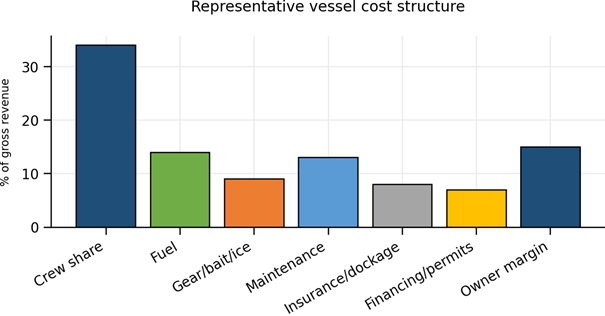
Representative cost shares; actual vessels vary by gear, debt, fuel burn, owner operation, and settlement practice.
| Role | Annual gross-share range | Monthly range in active season | September base-case income | Notes |
| Captain/operator | $65k-$180k | $7k-$25k | $9k-$20k | Often earns captain share plus owner economics if owner-operated |
| Experienced deckhand | $38k-$95k | $4k-$13k | $5k-$11k | Depends heavily on vessel class and successful trips |
| Engineer / mechanic-capable crew | $50k-$120k | $5k-$15k | $6k-$13k | Higher share or premium where skill is scarce |
| Greenhorn / first-season deckhand | $18k-$48k | $2k-$7k | $2.5k-$5.5k | Lower share; not ordinary hourly wage |
6. Gloucester Economic Impact
Direct activity is commercial harvesting and ex-vessel sales. Indirect activity is spending by vessels and fish businesses on fuel, ice, gear, bait, maintenance, marine electronics, welding, dockage, settlement/accounting, legal services, insurance, credit, refrigeration, trucking, cold storage, processors, and wholesalers. Induced activity is household spending from crew, captains, owners, and supplier employees.
No authoritative Gloucester-specific input-output multiplier was found in public sources during this research pass. Therefore this report uses a bottom-up local-impact bridge: direct dockside value of $61.0 million; indirect supplier activity of $35-$52 million; induced activity of $22-$36 million; and total Gloucester-area output/sales impact of $118-$149 million, with a base midpoint of $132 million. Value added is estimated at $56-$73 million. These are not GDP facts; they are modeled local economic impact estimates.
Chart 11 – Direct / indirect / induced impact
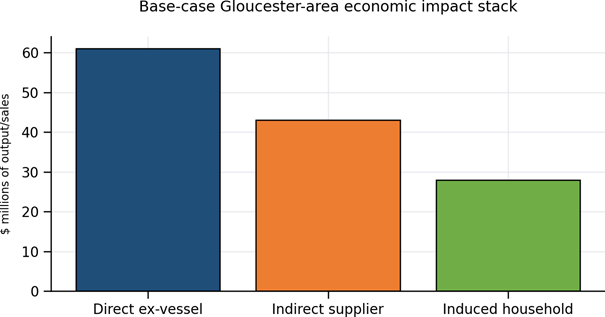
Direct ex-vessel sales plus modeled supplier and household-spending effects.
| Impact measure | Direct only | Direct + indirect | Total direct + indirect + induced |
| Output / sales | $61m | $96-$113m | $118-$149m |
| Value added / GDP-like | $27-$34m | $43-$58m | $56-$73m |
| Employment supported | 310-410 fishermen/crew + owners | 480-650 total jobs | 650-900 total full/part-time jobs |
| Labor / proprietor income | $22-$31m | $33-$44m | $43-$56m |
| Confidence | Medium for direct forecast; lower for local employment | Modeled | Modeled |
7. Gloucester Municipal Fiscal Impact
Dockside landings are not municipal revenue. The fiscal bridge is indirect: fishing activity supports business receipts, wages and profits; those support local spending and waterfront property activity; those affect the taxable base, meals/lodging activity, permits, leases, harbor fees, and service demands. Gloucester also faces public costs for harbor operations, public safety, emergency management, roads, seawalls, wastewater, resilience, and working-waterfront planning.
| Fiscal variable | Gloucester effect | Massachusetts effect |
| Property-tax base | Supports marine-industrial and fish-processing assessments; effect realized through property value stability, not landings tax | Not a state revenue source |
| Meals / lodging / tourism receipts | Small positive if working waterfront reinforces visitor demand; not fully causal | State meals/rooms taxes also benefit from hospitality |
| Harbor / waterways fees | Modest direct fee exposure through berthing, waterways, and harbor operations | $0 |
| Permits / licenses | Shellfish, inspectional, business, and health-related activity; likely <$0.2m incremental | State permit and compliance systems |
| Public safety / storm response | Potential negative cost in storm, rescue, spill, or harbor incident years | Coastal resilience and emergency-management exposure |
| Modeled gross activity-linked revenue | $0.4-$0.8m base; $0.2-$1.1m scenario range | $2.0-$3.0m base state tax/fiscal effect |
| Modeled net fiscal position | Near breakeven to modestly positive in normal years; negative after major storm/infrastructure event | Positive but small relative to state budget |
8. Essex County Economic Impact
Essex County does not function as a conventional county government for this purpose; the analysis therefore treats Essex County as a regional economic geography. Gloucester fishing is meaningful within the Cape Ann and North Shore marine economy but small relative to total Essex County GDP and employment. The base modeled Essex County output impact is $94 million, reflecting the portion of direct, supplier, processing, trucking, and household effects likely to remain within Essex County rather than leak to Boston, New Bedford, Rhode Island, Maine, New York, or national seafood supply chains.
| Variable | Gloucester/Cape Ann | Essex County | Massachusetts |
| Direct dockside value | $61m | $61m counted at port; some vessel owners/crew outside county | $61m within state landings |
| Total output impact | $118-$149m | $82-$108m | $60-$84m net incremental after leakages/double-counting |
| Value added / GDP-like | $56-$73m | $43-$55m | $32-$43m |
| Employment supported | 650-900 | 500-720 | 420-620 |
| Household income | $43-$56m | $31-$42m | $24-$34m |
| Principal sectors | Harvesting, docks, ice, repairs, restaurants, tourism | Trucking, processing, marine services, retail, households | Seafood distribution, restaurants, taxes, ports |
9. Massachusetts Statewide Impact
NOAA Fisheries reports 2023 U.S. commercial landings of 8.4 billion pounds valued at $5.1 billion and identifies New Bedford as the highest-value U.S. port for the 23rd consecutive year, driven primarily by sea scallops. A public NOAA-linked summary reported New Bedford 2023 landings of 76.9 million pounds valued at $363.3 million. Gloucester is therefore a major Massachusetts port by weight but materially smaller by value than New Bedford because Gloucester has a lower scallop share and more lower-value finfish and bait species.
Chart 6 – Gloucester versus Massachusetts landings
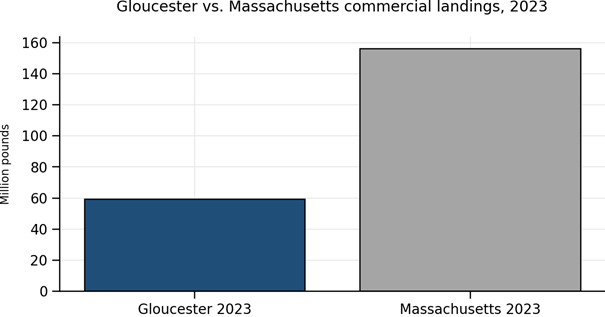
2023 benchmark comparison: Gloucester 59.3m lb and Massachusetts 156m lb.
Chart 7 – Gloucester versus New Bedford value
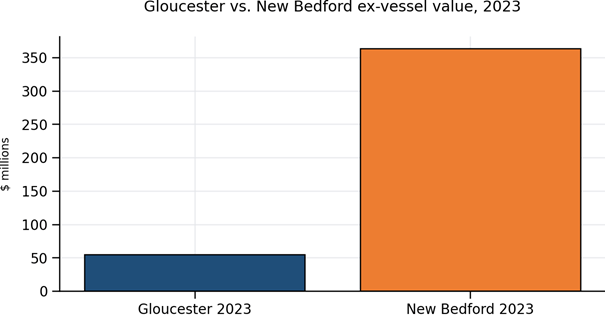
New Bedford value is driven primarily by sea scallops; Gloucester is more diversified and finfish-oriented.
Base 2026 Gloucester share estimates: about 36%-39% of Massachusetts commercial landings by weight if statewide volume remains near the 2023 benchmark; roughly 10%-12% of ex-vessel value if statewide value remains near $574 million; and materially less than that share of total seafood value added because Boston distribution, New Bedford scallops, imports, processing, retail, and restaurants dominate the statewide seafood economy.
10. Second-Order Effects
Waterfront economy
A stronger season increases dock turns, ice sales, fuel volume, gear work, forklift and lumping demand, cold storage use, fish handling, settlement activity, engine repair, welding, and electronics work. A weaker season lowers volume but can increase per-pound price and emergency repair cost if vessels fish harder in marginal weather.
Transportation and distribution
Higher landings increase refrigerated trucking to Boston, New Bedford, New York, and regional processors. Because Gloucester lacks the scale of historic fresh-fish processing, some value leaves the city unless local processing and cold-chain capacity expand.
Hospitality and tourism
The working waterfront supports Gloucester’s cultural brand. Causality is strongest for restaurants, seafood markets, waterfront tours, and maritime identity; it is weaker for general hotel occupancy, which is also driven by beaches, arts, events, and broader North Shore tourism.
Household economics
Crew and captain settlements convert fishing performance into local spending. A $10 million change in dockside value can plausibly move gross crew/captain income by $3-$4 million before taxes, debt, and household leakages.
Property and waterfront real estate
Strong fishing activity supports working-waterfront rents and marine-industrial land use. Weak activity increases pressure for non-marine uses and raises the risk that infrastructure is lost irreversibly.
Banking and credit
A good season improves vessel liquidity and loan quality but can also trigger reinvestment demand for engines, electronics, gear, quota, and working capital. A bad season increases delinquency, insurance, and refinancing risk.
Labor market
Labor is a binding constraint. Greenhorn hiring rises in strong years, but experienced crew, engineers, welders, diesel mechanics, and electronics technicians remain scarce.
11. September 2026 Outlook
September is critical because it overlaps fall bluefin opportunity, remaining groundfish effort, swordfish/large pelagics, and pre-winter market positioning. The base case assumes 18-21 fishable offshore days, the September General category bluefin subquota opens as scheduled, groundfish quota remains generally available, and storm disruption is moderate.
| September metric | Downside | Base | Upside |
| Fishable days | 13-16 | 18-21 | 22-25 |
| Gloucester landings | 4.4m lb | 6.0m lb | 7.5m lb |
| Dockside revenue | $4.1m | $6.4m | $9.2m |
| Representative tuna vessel gross revenue | $25k-$60k | $70k-$145k | $160k-$300k |
| Medium groundfish vessel gross revenue | $35k-$75k | $80k-$130k | $130k-$210k |
| Experienced deckhand gross share | $2.5k-$5.5k | $5k-$11k | $10k-$18k |
| Greenhorn gross share | $1.2k-$3.2k | $2.5k-$5.5k | $5k-$9k |
| Captain/operator gross share | $5k-$12k | $9k-$20k | $18k-$35k |
| Local spillover output | $8m-$10m | $13m-$16m | $19m-$24m |
Chart 12 – September seasonal economics
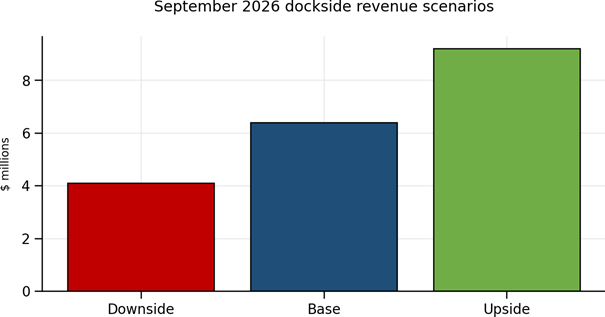
September downside/base/upside dockside revenue estimates.
12. Risk Analysis
| Risk | Transmission mechanism | 2026 relevance | Mitigation / monitoring |
| Weather / hurricanes / nor’easters | Lost days, safety risk, gear damage, insurance loss | High for Sep-Oct | Track NOAA marine forecasts, named-storm tracks, harbor readiness |
| Climate / SST anomalies | Species movement, bait availability, trip distance | High | Track SST fronts, Gulf of Maine anomalies, landings by species |
| Quota closure | Strong catch can exhaust subquota early | High for bluefin; stock-specific for groundfish | Monitor NOAA HMS and GARFO quota pages weekly |
| Biological availability | CPUE affects revenue and fuel per pound | High | Track dealer reports, CPUE, trip duration |
| Price risk | Seafood prices alter dockside value more than volume alone | High | Track Boston and dealer prices, restaurant demand |
| Fuel / repairs / insurance | Raises trip cost; lowers crew settlement and margins | High | Track diesel and repair lead times |
| Labor | Shortage limits trips and safety | Medium-high | Training, housing, crew pipeline |
| Regulatory / EM | Compliance cost and trip constraints | Medium | Engage NOAA/NEFMC/DMF processes |
13. Scenario and Sensitivity Analysis
| Variable | Downside | Base | Strong | Exceptional | Expected value |
| Probability | 20% | 45% | 25% | 10% | 100% |
| Gloucester landings | 48m | 57.5m | 65m | 76m | 59.3m |
| Dockside value | $48m | $61m | $75m | $92m | $65.0m |
| Average $/lb | $1.00 | $1.06 | $1.15 | $1.21 | $1.08 |
| Fishable days | 135 | 160 | 175 | 188 | 162 |
| Representative crew income | $9.5k | $13.5k | $17.0k | $22.0k | $14.4k |
| Industry operating profit | $4-$7m | $7-$11m | $11-$16m | $17-$25m | $9-$13m |
| Gloucester economic impact | $97m | $132m | $168m | $214m | $142m |
| Essex County impact | $71m | $94m | $119m | $151m | $101m |
| Massachusetts impact | $54m | $72m | $91m | $116m | $78m |
| Municipal fiscal effect | $0.35m | $0.55m | $0.75m | $1.05m | $0.61m |
| State fiscal effect | $1.7m | $2.4m | $3.1m | $4.2m | $2.6m |
| Sensitivity | Dockside value effect | Vessel EBITDA / margin effect | Crew income effect | Local impact effect |
| +10% landings volume | +$6.1m | +$1.8-$2.7m | +$2.0-$2.5m | +$12-$15m |
| -10% landings volume | -$6.1m | -$1.8-$2.7m | -$2.0-$2.5m | -$12-$15m |
| +10% seafood price | +$6.1m | +$4.0-$5.2m | +$2.0-$2.6m | +$12-$16m |
| -10% seafood price | -$6.1m | -$4.0-$5.2m | -$2.0-$2.6m | -$12-$16m |
| +20% diesel price | $0 direct price effect | -$1.8-$2.6m | -$0.6-$1.0m | -$3-$5m |
| 5 additional storm days | -$1.8m to -$2.4m | -$0.8-$1.2m | -$0.6-$0.9m | -$4-$6m |
| 10 additional storm days | -$3.2m to -$4.2m | -$1.5-$2.2m | -$1.1-$1.7m | -$8-$11m |
| Quota closure one month early | -$4m to -$7m | -$2m-$4m | -$1m-$2m | -$9-$16m |
| +10% CPUE | +$3m-$5m | +$2m-$4m | +$1m-$2m | +$7-$11m |
| -10% CPUE | -$3m-$5m | -$2m-$4m | -$1m-$2m | -$7-$11m |
Chart 14 – Sensitivity tornado chart
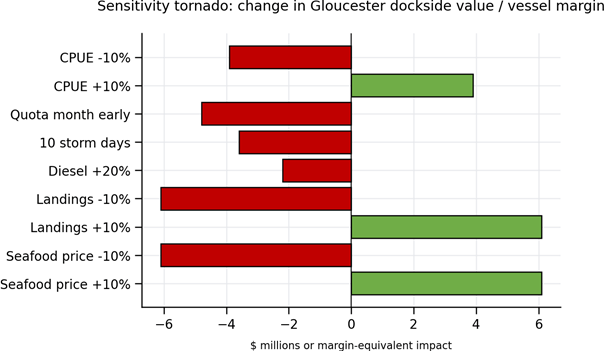
Price and volume have the highest dockside-value leverage; fuel and storms have the highest margin leverage.
14. Government Policy Implications
| Timing | Recommendation | Purpose | Indicative fiscal scale |
| Immediate, 0-12 months | Create a 2026 fishery monitoring dashboard for landings, quota, fuel, storm days, and harbor activity | Give officials a live risk picture through year-end | $25k-$75k staff/consultant or reallocation |
| Immediate, 0-12 months | Protect and inventory working-waterfront berths, hoists, ice, fuel, and repair capacity | Prevent loss of critical infrastructure | $50k-$150k planning; capital TBD |
| Immediate, 0-12 months | Develop a September-October storm and quota contingency protocol | Reduce avoidable downtime and safety risk | $10k-$50k |
| Medium, 1-3 years | Pursue dredging, dock repair, and transient commercial berth projects | Increase fleet utilization and visiting-vessel spending | $1m-$10m+ depending scope/grants |
| Medium, 1-3 years | Support marine trades workforce and crew training with schools and employers | Address crew, diesel, welding, electronics shortages | $100k-$500k/year with partners |
| Medium, 1-3 years | Expand cold-chain and small fresh-fish processing capacity | Capture more value locally | $500k-$5m+ public/private |
| Long, 3-10 years | Maintain Designated Port Area / marine-industrial land use and climate-resilient harbor infrastructure | Preserve strategic maritime capacity | $10m-$100m+ with state/federal grants |
| Long, 3-10 years | Create seafood branding, procurement, and value-added market program | Improve price realization and tourism-food linkages | $100k-$1m phased |
15. Conclusion
Final analytical judgment: 2026 is most likely an above-average modern commercial fishing year for Gloucester, not an exceptional historical-volume year. The base forecast is $61.0 million of Gloucester dockside value and $118-$149 million of Gloucester-area total economic output, with an expected-value dockside estimate of $63.0 million. The season can become unusually strong if September-October tuna activity is sustained, storm disruption remains limited, and dockside prices stay firm while quotas remain available. The forecast would fail if fall storms materially reduce fishable days, quota closures arrive earlier than modeled, or species distribution shifts away from Gloucester-accessible grounds.
Municipal decision-maker conclusion: For the Mayor, City Council, harbor planning officials, finance staff, and economic-development officials, the 2026 fishery offers a meaningful but volatile economic opportunity. The city should treat commercial fishing as a strategic working-waterfront asset that supports jobs, suppliers, tourism identity, and property-base stability, while recognizing that dockside revenue is not municipal revenue and that storm risk, infrastructure aging, quota limits, and labor shortages can quickly convert a strong biological season into a financially uneven local outcome.
References and Methodology Appendix
- S1: NOAA Fisheries, Fisheries of the United States Reports, current 2023 report page, last updated Feb. 9, 2026; includes U.S. landings and report links. https://www.fisheries.noaa.gov/resource/document/fisheries-united-states-reports
- S2: NOAA Fisheries, Fisheries of the United States overview, last updated Mar. 3, 2026; top ports and national landings context. https://www.fisheries.noaa.gov/national/sustainable-fisheries/fisheries-united-states
- S3: NOAA Fisheries, Fisheries Economics of the United States, last updated Jul. 15, 2026; 2023 sales, income, value-added, and jobs definitions. https://www.fisheries.noaa.gov/national/sustainable-fisheries/fisheries-economics-united-states
- S4: NOAA Fisheries, Commercial Atlantic Bluefin Tuna fishery statuses, minimum sizes, and retention limits, updated Aug. 7, 2026. https://www.fisheries.noaa.gov/atlantic-highly-migratory-species/commercial-atlantic-bluefin-tuna-fishery-statuses-minimum-sizes
- S5: NOAA Fisheries, 2026 Atlantic Swordfish Landing Updates, posted Jul. 23, 2026. https://www.fisheries.noaa.gov/atlantic-highly-migratory-species/2026-atlantic-swordfish-landing-updates
- S6: Federal Register, Atlantic HMS quota proposed rule, 91 FR 24789, May 7, 2026. https://www.federalregister.gov/documents/2026/05/07/2026-09059/atlantic-highly-migratory-species-north-atlantic-swordfish-south-atlantic-swordfish-north-atlantic
- S7: NOAA Fisheries Greater Atlantic Region, Quota Monitoring in the Greater Atlantic Region, last updated Mar. 24, 2026. https://www.fisheries.noaa.gov/new-england-mid-atlantic/commercial-fishing/quota-monitoring-greater-atlantic-region
- S8: NOAA GARFO, 080626 Commercial Groundfish Summary, generated Aug. 6, 2026. https://apps-garfo.fisheries.noaa.gov/quota-monitoring/groundfish/Commercial_Summary_2026.html
- S9: City of Gloucester, FY2027 Mayor Proposed Budget, version 2.0, June 1, 2026. https://gloucester-ma.gov/DocumentCenter/View/15810/FY-2027-PROPOSED-BUDGET-WEB
- S10: City of Gloucester Budgets page, budget process and budget documents. https://gloucester-ma.gov/559/Budgets
- S11: FRED/BEA, Real Gross Domestic Product: All Industry Total in Massachusetts, Q1 2026. https://fred.stlouisfed.org/series/MARQGSP
- S12: NOAA GFDL, April 2026 Northwest Atlantic Predictions, posted Apr. 21, 2026; experimental, not official NOAA forecast. https://www.gfdl.noaa.gov/prediction/april-2026-northwest-atlantic-predictions/
- S13: Sawyer Free Library Gloucester Timeline, 1980 landings record entry. https://timeline.sawyerfreelibrary.org/timeline/gloucester-fish-landings-reach-202-million-pounds-valued-at-36-million/
- S14: Gloucester Community Panel / MIT Sea Grant, Commercial Fishing Industry Needs on Gloucester Harbor, June 2005; includes 1975-2004 Gloucester tables. https://bpb-us-e1.wpmucdn.com/sites.mit.edu/dist/5/2141/files/2020/07/Gloucester_supp.pdf
- S15: Gloucester Community Panel / MIT Sea Grant, Study of Gloucester Commercial Fishing Infrastructure, Oct. 15, 2003. https://bpb-us-e1.wpmucdn.com/sites.mit.edu/dist/5/2141/files/2020/07/GloucesterNO.pdf
- S16: NOAA Fisheries, Brief History of the Groundfishing Industry of New England, last updated May 13, 2024. https://www.fisheries.noaa.gov/new-england-mid-atlantic/commercial-fishing/brief-history-groundfishing-industry-new-england
Inflation methodology: where the source series already provides 2002-dollar real values, this report preserves that basis for historical statistical calculations. The report does not convert all historical values to 2026 dollars because a complete CPI transformation was not required to support the main forecast and would create false precision without final 2026 CPI data. Current forecasts are nominal 2026 dollars.
Forecast limitations: public 2026 Gloucester-specific YTD port landings were not available in complete form during this research pass. Vessel counts, crew counts, species composition, local multipliers, and fiscal effects are modeled ranges. Official landings and tax data should replace these estimates when published.

