
Executive recommendation
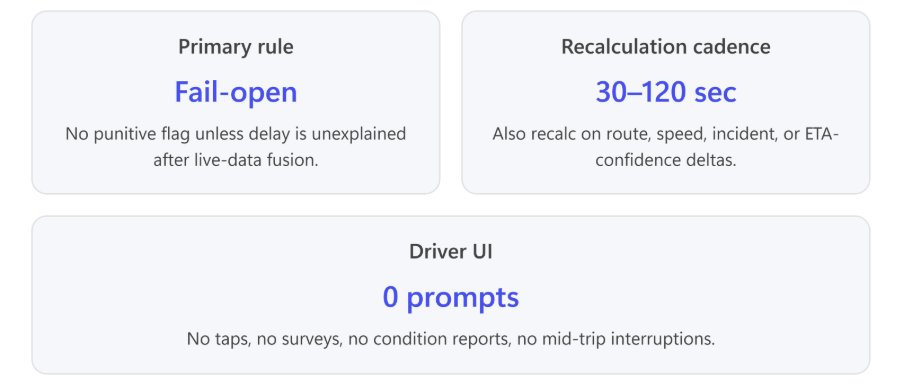
Lyft should replace any static, pre-trip duration threshold used for fraud/inefficiency review with a backend-only “dynamic expected duration” service that recalculates expected remaining time from the driver’s current map-matched GPS position every 30–120 seconds and after meaningful route/speed deltas. The key policy is fail-open for drivers: if live traffic, incidents, closures, weather, construction, event congestion, GPS ambiguity, or provider uncertainty plausibly explains delay, the system must not flag the trip.
Public evidence supports the feasibility: Lyft already uses historical and real-time data, ML, traffic and weather insights for ETA reliability1; Lyft has shifted major navigation control into Lyft Maps, built on OSM plus Lyft ride-derived data, with public claims that Lyft Maps powered 70% of rides as of 2023 and that 98% of drivers who try it stick with it2; Lyft also publicly describes real-time map matching from driver phone GPS for ETA and dispatch decisions3 and client/server map-data systems using S2 cells, DynamoDB, CloudFront, Envoy, SQLite, and C++ localization libraries4. Public sources do not disclose a Lyft “static trip-duration flagging formula”; the evidence instead shows Lyft has account flag/deactivation processes that can include fraud reviews5 and driver anecdotes about opaque safety/service flags6. Treat the duration-specific false-positive problem as a product requirement validated with Lyft internal data, not as publicly documented fact.
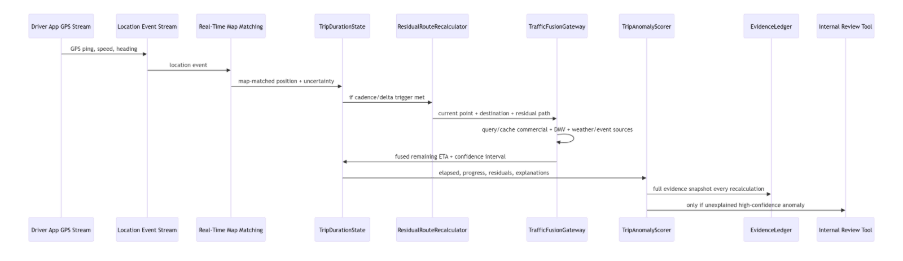
The architecture below shows the backend-only system boundary. It uses the existing high-frequency GPS stream, map matching, traffic providers, DMV public feeds, source fusion, anomaly scoring, and audit logs; the driver app remains navigation-only and no new driver-facing road-condition input is introduced.
Figure 1: Backend-only dynamic trip-duration flagging architecture for a DMV pilot: existing GPS feeds drive map matching, residual ETA recomputation, multi-source traffic fusion, anomaly scoring, and evidence logging without driver prompts.
1. Current-state analysis
Lyft publicly says ETA reliability is driven by complex algorithms using historical and real-time data, ML, traffic and weather insights before a ride is requested7. Lyft’s ETA reliability model uses nearby driver features, historical geohash-level trends, marketplace demand/supply signals, pickup/drop-off location, time, and region; it also cites LyftLearn for model serving, training, feature serving, monitoring, drift detection, and retraining8. For this pilot, reuse that pattern but shift from pre-request pickup ETA reliability to in-trip residual ETA reliability.
Lyft’s map stack has moved from third-party navigation dependence toward Lyft Maps. Lyft’s 2023 blog says Lyft previously relied on Google Maps for the navigation experience, while Lyft used its own algorithms to predict time and cost; Google’s post-acceptance route could differ from Lyft’s calculated route, creating cost disconnects9. The same source says the breakthrough was using OpenStreetMap, Lyft ride coverage, and map data collection to support Lyft Maps; it also states Lyft Maps powered 70% of rides at that time and drivers could choose other navigation apps10.
Lyft already has public map-matching infrastructure suited to this update. Lyft Engineering says GPS from driver phones is noisy; Lyft map matching maps raw GPS to road segments and is used at end of ride for distance/fare and in real time for ETA, dispatch, and vehicle display11. Lyft’s newer real-time map-matching algorithm uses a marginalized particle filter with probability, trajectory, position/velocity mean, and covariance; the output can be used as a distribution of possible ETAs12. That probabilistic output is directly useful for duration-flagging confidence intervals.
The public record on driver-facing flags is incomplete. Lyft Help says deactivation reasons can include fraud, safety concerns, low ratings, background/DMV checks, and vehicle issues; it also says a driver account can be flagged by a user or Lyft and placed on hold during review13. Lyft says drivers can appeal permanent deactivation and submit evidence such as dashcam footage, photos, and police reports14. Driver forums contain anecdotes of unexplained service/safety flags, including one driver reporting 3–4 flags in 2.5k rides and not knowing what they were for15. These anecdotes are low-evidence but product-relevant: the pilot should reduce opaque flags and improve auditability.
2. Dynamic expected-duration architecture
Core services
| Service | Responsibility | Production behavior |
| TripDurationState | Maintains trip start, destination, elapsed time, map-matched path, current residual route, and recalculation history | Consumes trip and location events; emits state snapshots |
| ResidualRouteRecalculator | Calls routing providers and/or Lyft Maps routing from current GPS to destination | Runs every 30–120 sec, on >400m route drift, >60 sec ETA jump, incident update, or low-confidence GPS |
| TrafficFusionGateway | Normalizes Google, Mapbox, TomTom, HERE/INRIX, CHART, VDOT, DDOT, weather/event data | Adds source timestamp, confidence, route overlap, freshness |
| DynamicDurationModel | Computes expected remaining time, expected total duration, and uncertainty band | Stores expected_total = elapsed + fused_remaining_eta |
| TripAnomalyScorer | Flags only unexplained deviations | Uses residual z-score, live-speed mismatch, detour ratio, stop/no-progress state |
| EvidenceLedger | Immutable audit trail for review/appeals | Logs GPS trace, route snapshots, provider responses, incident/weather snapshots, scoring features |
Source-fusion rule
- Base route: Lyft Maps road graph + real-time map-matched driver position. Lyft Maps is suitable because Lyft says its mapping systems use driving locations, sensor data, and user feedback to optimize routes and safe drop-off locations16.
- Live traffic ETA: Mapbox driving-traffic, Google Routes Pro, TomTom Routing/Traffic, or HERE/INRIX.
- DMV public enrichment: CHART, VDOT, DDOT feeds for incidents, closures, work zones, signal issues, cameras, speed sensors, DMS, and traffic volumes.
- Confidence fusion: weighted median of provider ETAs, adjusted by route-overlap, freshness, and provider historical error in DMV corridors.
- Fail-open: if provider disagreement or public-feed evidence is high, widen uncertainty and suppress flags.
Statistical flagging logic
Recommended scoring is not “actual duration > original estimate.” Instead:
- Compute segment-level residuals: actual_traverse_seconds – p95_expected_seconds_for_same_segment_live_state.
- Attribute residuals to known explanations: congestion, closures, incidents, weather, special events, signal failures, route detours caused by routing engine, GPS uncertainty.
- Accumulate only unexplained delay.
- Trigger review only if all conditions hold:
unexplained_delay_z > 3, unexplained_delay_minutes > 8, sustained for at least 3 recalculations, no live explanation, GPS confidence high, and route deviation not rider/destination-driven.
- Never auto-punish. Send to internal review with evidence packet.
3. Provider stack and pricing
| Provider | Relevant product | Publicly documented capability | Pricing / access note | Recommendation |
| Google Maps Platform | Routes API Compute Routes Pro / Route Matrix Pro | Traffic-aware routing triggers Pro; Compute Routes billed per request; Matrix billed per element; 3,000 QPM Compute Routes limit17 | Pro Compute Routes list price ranges from $10/1k at low volume to $0.75/1k at 5M+ monthly events; Google says additional discounts may require 10M+ monthly events and signed order form18 | Use as high-quality fallback/oracle and for appeals sampling, not every ping |
| Mapbox | Directions API mapbox/driving-traffic | Uses current/historic traffic; supports congestion, numeric congestion, speed, maxspeed, closure annotations, incidents, duration vs typical duration19 | Official page describes free tiers, pay-as-you-go, volume discounts, and Directions billing by request20; public trackers cite 100k free Directions requests and ~$2/1k dropping with volume21 | DMV primary residual-route API for pilot; negotiate for national |
| TomTom | Routing API + Traffic Incident/Flow + Intermediate Traffic | Routing calculates optimal routes with traffic; traffic APIs include incident details, flow/incident tiles, segment flow, and server-side Intermediate Traffic22 | Official page shows free monthly counts: Routing 20k, Matrix 2.5k, Traffic Incident 2.5k, Traffic Flow segment 20k, tiles 200k23; third-party benchmark cites overage $0.75–$6/1k for routing and enterprise custom contracts24 | Best DMV public-feed complement and segment cache candidate |
| HERE | Routing API + traffic | HERE REST APIs include traffic-enabled routing, matrix routing, route matching, geofencing, map attributes, and logistics/fleet features25 | HERE official page says sign up free and pay-as-you-grow26; third-party sources describe transaction pricing and enterprise agreements27 | Enterprise negotiation candidate for national traffic data |
| INRIX | XD Traffic, Speed, Safety Alerts, Routing | INRIX APIs provide real-time traffic/parking data; products include traffic for 50+ countries, speed, incidents, cameras, and traffic-influenced routing28 | Requires credentials requested through INRIX; public self-serve pricing not found29 | Use if Lyft can secure enterprise feed; excellent independent traffic source |
DMV public feeds
- Maryland CHART: data feeds are available in JSON and XML for traffic incidents/events, active closures, cameras, speed sensors, weather stations, DMS, travel-time routes, WZDx, and spatial services30. CHART speed data auto-refreshes every five minutes31 and incident/event pages refresh every 90 seconds32.
- VDOT SmarterRoads / 511 Virginia: SmarterRoads provides raw and processed data to approved users, including road conditions, incidents, work zones, signal data, and real-time/near-real-time streams33. Relevant feeds include DMS, RWIS, traffic sensors, travel times, VDOT incidents, closures, weather events, and WZDx, many at one-minute cadence34.
- DDOT / Open Data DC: Traffic Camera has an ArcGIS REST API returning JSON and is used for planning/management of traffic controls and incidents35. DC 2024 Traffic Volume is a public CC BY 4.0 feature layer with 21,942 records, updated/published February 9, 2026, but it is annual AADT—not real-time speed36.
Supplementary enrichment
Use OpenWeather or AccuWeather for weather context. OpenWeather’s free plan lists 60 calls/minute and 1,000,000 calls/month; One Call 4.0 includes government alerts and updates as often as every 10 minutes on paid tiers37. AccuWeather Standard is $25/month for 225k calls; Prime is $250/month for 1.8M calls and includes government severe-weather alerts; Elite is $500/month for 2.4M calls38. Use Ticketmaster Discovery for scheduled venue events: it has 230k+ events, 5,000 calls/day, 5 requests/second, and market IDs for Virginia and Washington DC/Maryland39. PredictHQ is better for enterprise event impact because it advertises 100M+ events, 19 categories, rank/location, predicted attendance/spend/impact, and real-time Events API access40.
4. Implementation blueprint
Recommended stack
- Languages: Go for low-latency gateway/scoring services, Python for model training/evaluation, Java/Kotlin where existing trip services require.
- Streaming: Kafka or Pulsar. Lyft Engineering publicly describes Kafka as central for correctness/freshness, buffering backpressure, partition ordering, at-least-once/exactly-once semantics, and modular stream routing41.
- Geospatial: Lyft Maps road graph; PostGIS/BigQuery for geospatial analytics and audit queries. Lyft Map Data roles publicly list PostGIS, BigQuery, Python, Go, Java/C++, AWS/GCP/Azure as relevant skills42.
- Storage: Redis/KeyDB for segment traffic cache; DynamoDB/Cassandra for trip-state snapshots; S3/GCS object storage for evidence packets; warehouse table for offline replay.
- ML: start with deterministic residual rules; add gradient-boosted residual model because Lyft states tree-based models are a historic choice for lightweight structured classification tasks43.
- Observability: per-provider latency, timeout, route-error, source freshness, ETA error, false-positive review outcome, and cost per completed trip.
Sequence diagram
Pseudocode
1 def on_location_ping(trip_id, gps):
2 mm = map_match(gps) # road segment, heading, speed, uncertainty
3 state = trip_state.load(trip_id).append(mm)
4
5 if not should_recalculate(state):
6 return
7
8 residual_route = routing_gateway.compute(
9 origin=mm.road_position,
10 destination=state.destination,
11 mode=”rideshare_car”,
12 traffic=”live”,
13 alternatives=True,
14 annotations=[“speed”, “congestion”, “closure”, “incidents”]
15 )
16
17 public_context = public_feed_cache.lookup(route=residual_route.geometry)
18 weather_event_context = enrichment_cache.lookup(route=residual_route.geometry,
19 time=now())
20
21 fused = fuse_eta(
22 commercial_routes=residual_route,
23 dmv_context=public_context,
24 weather_events=weather_event_context,
25 provider_error_priors=dmv_provider_priors()
26 )
27
28 state.expected_remaining = fused.remaining_eta
29 state.expected_total = state.elapsed + fused.remaining_eta
30 state.confidence_band = fused.confidence_band
31 trip_state.save(state)
32
33 residual_features = build_residual_features(state, fused)
34 score = anomaly_model.score(residual_features)
35
36 evidence_ledger.write(trip_id, state, fused, residual_features, score)
37
38 if score.high_confidence_unexplained and not fused.has_explanatory_context:
39 review_queue.enqueue(trip_id, reason=”dynamic_duration_unexplained”)
5. Driver-app UI/UX changes
Remove all driver-facing road-condition collection flows related to duration flagging:
- In-ride**“Report later” navigation issue** flow. Lyft Help says drivers can tap “Report later” during a ride and later select an issue type and submit feedback.
- Offline flag icon navigation feedback flow. Lyft Help says drivers can click a flag icon, select a category, add optional comment, and submit.
- Post-trip**“Report navigation or road issue”** flow. Lyft Help says drivers can go to trip details, choose the ride, place a pin where the issue occurred, select a feedback category, add optional comment, and submit.
- Any future or experimental prompt asking drivers to share accidents, traffic jams, loading-zone issues, hazards, closures, or construction. Lyft’s blog describes such driver-shared map information as an idea under consideration, not as a mandatory production requirement.
Do not remove emergency help, tap-to-arrive/pick-up/drop-off workflow, or navigation itself. Lyft Maps should remain passive for condition logging; Lyft Help already says a simpler map appears when the vehicle is in motion and more features are revealed once stopped.
6. Cost model
Lyft reported 945.5 million rides in 2025. The chart below estimates annual API spend for 3–5 residual route calls per completed ride using public/reference rates; it excludes enterprise discounts and internal Lyft routing substitution.
Figure 2: Illustrative annual routing API spend at Lyft 2025 ride volume. Google uses the high-volume public Pro list-price floor; Mapbox/TomTom use public reference rates and should be replaced with negotiated enterprise quotes.
| Scenario | Calls/year | Google Routes Pro at $0.75/1k | Mapbox reference at $1.20/1k | TomTom range $0.75–$6/1k |
| 3 calls/ride | 2.84B | ~$2.13M | ~$3.40M | ~$2.13M–$17.0M |
| 4 calls/ride | 3.78B | ~$2.84M | ~$4.54M | ~$2.84M–$22.7M |
| 5 calls/ride | 4.73B | ~$3.55M | ~$5.67M | ~$3.55M–$28.4M |
For a DMV pilot, replace public ride-share assumptions with Lyft internal trip counts. If the DMV pilot represents 1% of 2025 ride volume—an explicit modeling assumption, not a public Lyft metric—then 4 calls/ride equals ~37.8M calls/year, or roughly $28k/year at Google’s high-volume floor and ~$45k/year at the Mapbox reference rate. Infrastructure for the pilot should be modest relative to API cost: streaming consumers, Redis cache, state store, evidence object storage, and dashboards; use internal cloud unit costs for the final budget.
One-time effort estimate: backend platform 6–8 PM, routing/provider integrations 5–7 PM, DMV feed ingestion 3–4 PM, anomaly model/validation 5–7 PM, data engineering/audit ledger 3–5 PM, driver-app cleanup 1–2 PM, QA/SRE/security/legal review 4–6 PM, product/analytics 3–4 PM. Total: 30–43 person-months. This is effort sizing, not a delivery promise.
7. Rollout, experimentation, and validation
Roll out behind feature flags: dynamic_duration_shadow, dmv_live_context_enabled, duration_flag_suppress_only, review_queue_enabled, and finally replace_static_duration_flag. Start in shadow mode: compute dynamic expected duration but do not alter flags; compare historical static flags against dynamic explanations.
A/B design: randomize by DMV trips or geo-hash/time blocks, not individual driver identity, to avoid repeated exposure bias. Primary metrics: false-positive flag rate, manual-review overturn rate, driver support contacts about duration/fare flags, rider ETA absolute error, route ETA calibration, and unexplained-delay precision. Guardrails: rider cancellation, trip completion, support escalations, API timeout rate, provider cost per trip, and missing-data suppression rate.
Offline validation uses historical Lyft GPS traces, end-of-trip map matching, and archived/provider traffic where available. SmarterRoads explicitly supports historical data access after login/subscription; OpenWeather offers historical endpoints and One Call history products; TomTom offers Traffic Stats and route monitoring products, though some require contact sales. Replay each trip as if online: feed GPS pings chronologically, query archived/current-equivalent context, recompute residual ETA, and label whether delay was traffic-explained, route-explained, GPS-uncertain, rider/destination-change-related, or unexplained.
Success criterion: the new system should suppress all traffic-explained duration flags, preserve or improve rider ETA calibration, and send only high-confidence unexplained cases to review. If live-data coverage is missing, stale, conflicting, or outside confidence bounds, the operational rule is simple: do not flag the driver for duration.

