Executive summary
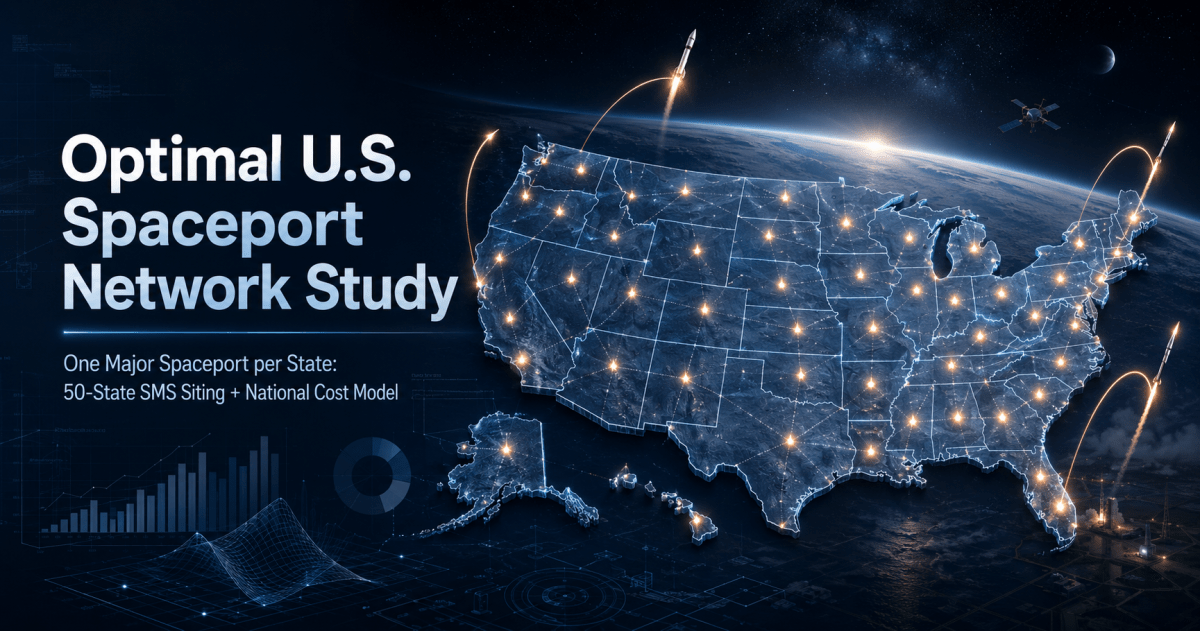
Using a GIS-informed, MCDA/AHP-style desk model, the most realistic “one major spaceport per state” network is not 50 Cape Canaverals: it is a tiered system of coastal orbital ports, federal-range upgrades, inland horizontal/reentry ports, and suborbital/test corridors. FAA’s current spaceport list is concentrated in only a handful of states—Alabama, Alaska, California, Colorado, Florida, Georgia, New Mexico, Oklahoma, Texas, and Virginia—so most states would require new brownfield airport/range conversions rather than expansion of existing licensed sites. FAA licensing also requires launch-site location, layout, supported vehicle types, azimuths, environmental review, risk analysis, and coordination with airspace and maritime authorities, which makes population exposure and downrange corridors decisive constraints. [faa.gov] [ecfr.gov]
The model is calibrated to public benchmarks: Spaceport America cost $218.5M and includes an 18,000-acre site, 12,000-by-200-foot runway, 6,000 square miles of restricted airspace, and both tenants and vertical/horizontal activity; MARS Pad 0A cost about $90M; Spaceport Cornwall’s airport conversion cost £20M; BCG states spaceport capex can range $100M–$500M depending on scope and complexity; and the FAA-backed National Spaceport Network plan identified 44 projects totaling over $382M before a full nationwide buildout. AACE-style early estimates are inherently wide—Class 4 and Class 5 ranges are commonly about −30%/+50% and −50%/+100%, respectively—so these are planning-order estimates, not engineer’s estimates. [krqe.com], [spaceportamerica.com] [spacenews.com] [spaceportc…rnwall.com] [web-assets.bcg.com] [faa.gov] [us-prod.as…rosoft.com]
The standardized SMS architecture is shown below: one dual-use runway, one vertical pad complex, processing/hangar facilities, propellant systems, range safety, telemetry, utilities, security, emergency response, and visitor/STEM functions. FAA’s Part 420 framework explicitly asks applicants to define launch points, vehicles, azimuths, flight corridors, environmental compliance, expected casualty risk, and ATC/Coast Guard agreements; Spaceport America and MARS illustrate why runway, range, payload, and control-center co-location matters. [ecfr.gov] [spaceportamerica.com], [vaspace.org]
Figure 1: Conceptual State Major Spaceport layout: a dual-use runway and vertical pad complex share processing, range-safety, payload, propellant, utility, security, and public-facing zones while maintaining buffer areas and trajectory corridors.
Methodology and scoring framework
Facility definition. The 2035–2050 SMS is a commercial-capable, FAA-licensable, dual-use space transportation node: at least one vertical pad or pad complex; one runway target of roughly 10,000–12,000 ft for spaceplanes, air-launch, and reentry; payload and vehicle processing; propellant farms; mission/range control; telemetry/radar; roads, power, water, fiber, security, emergency response, and public/STEM facilities. It is sized for small-to-medium reusable vehicles, with expandability for higher cadence or heavy-lift where geography allows. Spaceport America demonstrates the dual-use template, while PSCA and MARS demonstrate specialized vertical/polar and East Coast orbital roles. [spaceportamerica.com], [akaerospace.com], [vaspace.org]
Weights. I used six weighted categories: geographic/orbital performance 22%, safety/population/downrange 20%, meteorology/environment/hazards 15%, infrastructure/workforce/access 18%, regulatory/economic support 15%, and land/cost/funding feasibility 10%. This mirrors academic GIS/AHP spaceport-siting literature, which emphasizes population density, workforce, environmental constraints, transportation, utilities, and AHP/GIS overlays, and NAS facility-location research that explicitly models population density, trajectories, air-traffic rerouting, launch demand, and spatial resilience. [hammer.purdue.edu] [arxiv.org]
Interpretation. Scores are comparative within a state and across the 50-state network, not FAA determinations. Sites below ~55 are marginal and should be considered primarily horizontal/reentry, air-launch, research, training, or suborbital facilities unless technology or regulation changes materially. FAA’s 2026 forecast projects commercial operations rising from 214 in FY2026 to 507 in FY2036 in the high case, but it also warns that technology, companies, reusable vehicle tempo, mishaps, and regulation create major forecast uncertainty. [faa.gov]
50-state selected-site dataset
Legend: H = horizontal/spaceplane/air-launch/reentry; V = vertical launch; “small” means small/medium-class only; costs are mid-case capex in 2026 dollars, $M, before project-specific escalation. Official FAA-listed sites are grounded in FAA’s spaceports-by-state inventory; non-listed sites are model-selected candidates requiring full feasibility, NEPA, airspace, range, and local land-use review. [faa.gov], [ecfr.gov]
| State | Optimal SMS location | Role | Score | Mid $M |
| AL | Huntsville International / Redstone | H/reentry + aerospace cluster | 78 | 550 |
| AK | Pacific Spaceport Complex–Alaska, Kodiak | V polar/SSO | 88 | 850 |
| AZ | Yuma International / Yuma Proving Ground | H + V-suborbital | 73 | 700 |
| AR | Blytheville / Eaker Field | H-suborbital | 61 | 520 |
| CA | Vandenberg SFB / Santa Maria support | V+H polar/SSO | 94 | 650 |
| CO | Colorado Air & Space Port | H | 72 | 430 |
| CT | Bradley International | H/reentry constrained | 49 | 650 |
| DE | Dover AFB corridor | H + small V coastal | 63 | 650 |
| FL | KSC / Cape Canaveral / SLF-LC46 | V+H heavy | 98 | 400 |
| GA | Camden / Brunswick coastal site | small V | 70 | 750 |
| HI | Kona + west Hawaii coastal pad zone | H + small V | 71 | 950 |
| ID | Mountain Home AFB corridor | H-suborbital | 58 | 560 |
| IL | MidAmerica St. Louis / Scott AFB | H/reentry | 59 | 520 |
| IN | Grissom Air Reserve Base | H/reentry | 56 | 520 |
| IA | Sioux Gateway / former AFB | H-suborbital | 55 | 500 |
| KS | Salina Regional / former Schilling AFB | H-suborbital | 62 | 480 |
| KY | Barkley Regional / Paducah | H-suborbital | 54 | 520 |
| LA | Chennault International / Lake Charles | H + small V Gulf | 61 | 650 |
| ME | Brunswick Executive / former NAS | H + small V Atlantic | 61 | 700 |
| MD | NAS Patuxent River corridor | H + small V Atlantic | 64 | 650 |
| MA | Joint Base Cape Cod / Otis | H + small V Atlantic | 63 | 750 |
| MI | Oscoda-Wurtsmith | H/reentry | 67 | 550 |
| MN | Duluth International / ANG | H/reentry | 60 | 550 |
| MS | Stennis International / NASA Stennis | H + test | 69 | 650 |
| MO | Whiteman AFB corridor | H-suborbital | 57 | 600 |
| MT | Great Falls / Malmstrom corridor | H-suborbital | 61 | 550 |
| NE | Lincoln Airport / former AFB | H-suborbital | 58 | 500 |
| NV | Tonopah Test Range Airport | H + small V range | 76 | 600 |
| NH | Pease International Tradeport | H/reentry | 57 | 650 |
| NJ | Atlantic City Intl / FAA Tech Center | H/reentry | 59 | 650 |
| NM | Spaceport America | H+V | 89 | 300 |
| NY | Griffiss International / Rome | H/reentry | 62 | 520 |
| NC | Global TransPark / Kinston | H + small V | 63 | 600 |
| ND | Grand Forks AFB / Grand Sky | H-suborbital | 62 | 520 |
| OH | Wilmington Air Park | H/reentry | 60 | 520 |
| OK | Infinity One / Clinton-Sherman | H | 74 | 380 |
| OR | Kingsley Field / Klamath Falls | H-suborbital | 59 | 600 |
| PA | Pittsburgh International campus | H/reentry | 58 | 600 |
| RI | Quonset State Airport | H/reentry, runway extension | 53 | 700 |
| SC | Charleston Intl / Joint Base | H + small V Atlantic | 64 | 650 |
| SD | Ellsworth AFB / Rapid City | H-suborbital | 58 | 550 |
| TN | Arnold AFB / Tullahoma-AEDC | H + hypersonic/test | 62 | 600 |
| TX | Boca Chica / Starbase + Brownsville | V heavy; public-use caveat | 93 | 450 |
| UT | Dugway Proving Ground / Michael AAF | H + small V | 72 | 600 |
| VT | Burlington International / VTANG | H/reentry constrained | 46 | 650 |
| VA | MARS / Wallops Flight Facility | V orbital | 92 | 450 |
| WA | Grant County International / Moses Lake | H/reentry | 65 | 500 |
| WV | Eastern WV Regional / Martinsburg | H/reentry | 52 | 580 |
| WI | Volk Field / Camp Douglas | H-suborbital | 57 | 550 |
| WY | Casper-Natrona County Intl | H-suborbital | 60 | 500 |
Cost model and national totals
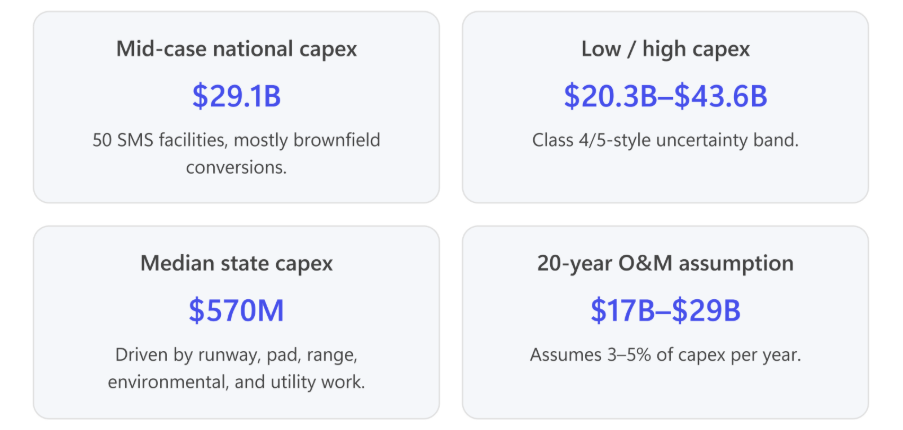
The mid-case model totals $29.07B capex, with a $20.35B low and $43.61B high case. By region: South $9.05B, West $7.79B, Midwest $6.36B, and Northeast $5.87B. By pathway: 13 existing/federal/licensed upgrades = $7.06B, 30 horizontal/reentry brownfield conversions = $16.96B, and 7 new vertical-capable coastal/range projects = $5.05B. The chart below visualizes those model outputs.
Figure 2: Mid-case SMS capital cost distribution by region and facility pathway, generated from the 50-state planning dataset.
Cost components. A typical SMS budget includes land/site control, geotechnical and environmental studies, runway extension or rehabilitation, pad/flame trench/deluge systems, vehicle and payload buildings, propellant storage, mission/range control, telemetry/radar, power/water/fiber, roads/rail/aprons, security, ARFF/emergency response, STEM/visitor facilities, environmental mitigation, licensing, owner’s costs, and contingency. The benchmark spread is wide: Spaceport America’s full first phase was $218.5M; MARS Pad 0A alone was about $90M; Spaceport Cornwall’s airport conversion was £20M; Las Vegas Spaceport’s proposed overall project is at least $310M; and BCG’s general capex range is $100M–$500M for construction scope that includes control centers, hangars, runways, taxiways, launch pads, and communications equipment. [krqe.com] [spacenews.com] [spaceportc…rnwall.com] [fox5atlanta.com] [web-assets.bcg.com]
O&M and funding. A planning assumption of 3–5% of capex per year gives a 20-year O&M envelope of roughly $17B–$29B on the mid-case network. Funding should mirror airport precedent: the FAA-backed network plan notes that spaceports lack a comparable federal infrastructure program, even though airports have AIP grants, PFCs, tax-exempt bonds, state/local grants, and operating revenues; it proposes a Spaceport Network Improvement Program with federal cost sharing and prioritization for safety, capacity, efficiency, and resiliency. [faa.gov]
National network assessment
The network would be resilient but overbuilt for today’s demand. Florida, California, Texas, Virginia, Alaska, and New Mexico carry the orbital backbone; Alabama, Colorado, Oklahoma, Washington, Michigan, Ohio, and New York serve horizontal/reentry, manufacturing, and training markets; and small states in the Northeast are mostly contingency, point-to-point, or reentry assets. This follows the FAA-supported network logic that not all spaceports are alike but, in combination, they can support different vehicle sizes, vertical/horizontal operations, orbital/suborbital profiles, and trajectories. [faa.gov]
The most strategic near-term investments are upgrades, not greenfields: KSC/Cape Canaveral, Vandenberg, MARS/Wallops, PSCA, Spaceport America, Oklahoma, Colorado, Huntsville, and Texas. PSCA is uniquely valuable for high-inclination, polar, and SSO access from 59° to 110° inclination and already has six pads and range facilities on 3,700 acres; MARS is one of the few U.S. FAA-licensed vertical orbital sites and provides small/mid-class orbital access with inclinations around 38°–60°. [akaerospace.com] [vaspace.org]
Low-priority / marginal states and alternatives
The weakest in-state cases are Vermont, Connecticut, Rhode Island, West Virginia, Kentucky, Iowa, Indiana, and Missouri because they combine dense airspace or limited downrange corridors with modest launch-demand pull. They should still receive an SMS candidate for network equity, but the prudent model is horizontal/reentry + aerospace workforce + emergency diversion, not routine vertical orbital launch. FAA and academic work both indicate that population density, flight corridors, and NAS impacts are core siting constraints. [ecfr.gov], [arxiv.org]
Roadmap and policy enablers
- 2026–2030: national GIS screening and statutory funding design. Build authoritative layers for population, protected lands, airspace, hazards, runways, utilities, and workforce; establish SNIP-style federal matching; update Part 420 toward performance-based regulation where appropriate. [faa.gov], [ecfr.gov]
- 2030–2035: upgrade proven nodes. Prioritize FL, CA, VA, AK, NM, TX, OK, CO, and AL; target range modernization, payload processing, autonomous flight safety, and runway/pad hardening.
- 2035–2040: coastal and military-range conversions. Add GA, HI, ME, MA, MD, SC, LA, MS, UT, NV, AZ.
- 2040–2050: horizontal/reentry inland network. Convert former AFBs and major airports where demand exists; defer marginal states unless point-to-point or spaceplane markets mature.
Key risks are overcapacity, local environmental opposition, NEPA/permitting uncertainty, airspace closures, climate hardening, launch-vehicle market consolidation, and technology shifts toward air-launch, reusable spaceplanes, or fewer larger rockets. FAA’s own forecast emphasizes uncertainty from reusable vehicle cadence, mishaps, regulatory changes, and changing launch-provider rosters; BCG likewise warns that new spaceports may operate for years before reaching target ROI and must differentiate on schedule reliability, value, regulation, talent, and customer-centric services. [faa.gov] [web-assets.bcg.com]

