Skip to content

Jarad Ponce

Entrepreneur

  • Home
  • Posts
  • Contact

Author: jaradponce

Just ask
Title graphic for Simulated Annealing-Enhanced Logistic Model for Breast Cancer Classification, combining breast-cancer cell imagery with logistic-regression, ROC-curve, feature-importance, and simulated-annealing optimization visuals. The report analyzes the Wisconsin Breast Cancer dataset and compares standard logistic regression with a simulated-annealing-optimized model, achieving roughly 95–97% classification accuracy.
Simulated Annealing-Enhanced Logistic Model for Breast Cancer Classification August 11, 2026
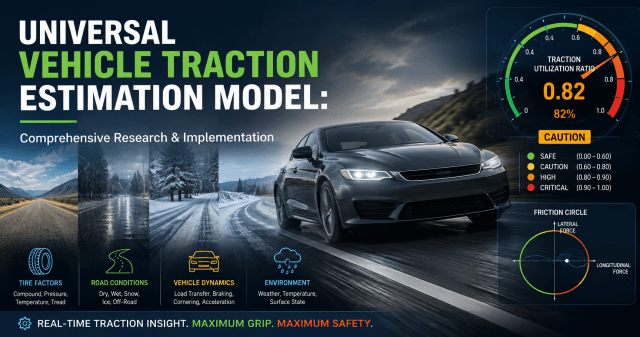
Universal Vehicle Traction Estimation Model report cover showing a modern vehicle driving across changing road conditions, including dry pavement, rain, snow, and ice, with a Traction Utilization Ratio gauge, friction-circle graphic, and indicators for tire factors, vehicle dynamics, and environmental conditions.
Universal Vehicle Traction Estimation Model: Comprehensive Research & Implementation August 11, 2026August 11, 2026
Dynamic real-time trip-duration flagging for the Lyft Driver App DMV pilot, illustrated with a rideshare vehicle, GPS route, location markers, data network, and Washington, D.C. skyline.
Production Specification: Dynamic Real-Time Trip-Duration Flagging for Lyft Driver App — DMV Pilot  August 11, 2026
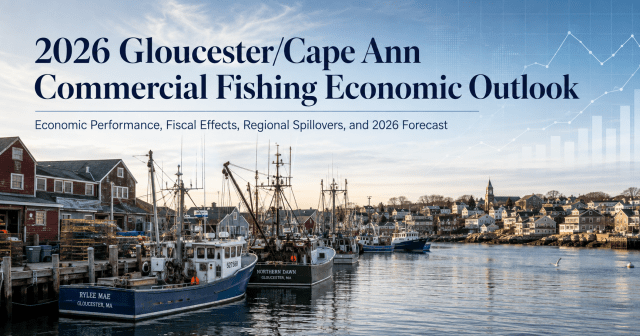
Commercial fishing boats docked in Gloucester Harbor, Massachusetts, beneath the title “2026 Gloucester/Cape Ann Commercial Fishing Economic Outlook,” with subtle economic charts and data graphics illustrating regional fishing, fiscal, and economic analysis.
2026 Gloucester/Cape Ann Commercial Fishing Economic Outlook and Regional Impact Study August 11, 2026
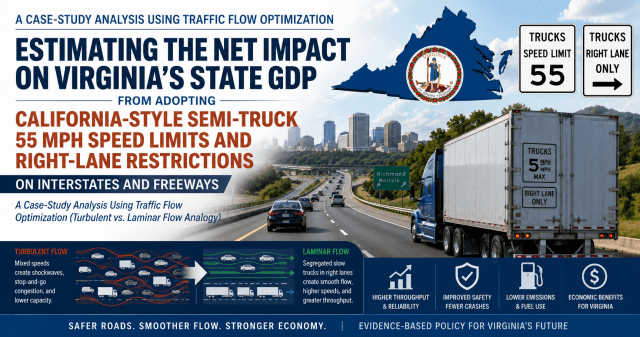
Wide-format policy report cover graphic showing a Virginia interstate highway with passenger vehicles and a semi-truck traveling under proposed 55 mph truck speed limit and right-lane restriction signs. The Virginia state outline and seal appear above the roadway, alongside visual comparisons of turbulent versus laminar traffic flow patterns. The design includes transportation, safety, fuel, emissions, and economic icons illustrating the report theme of analyzing the GDP impact of California-style truck regulations in Virginia using traffic flow optimization concepts.
Estimating the Net Impact on Virginia’s State GDP from Adopting California-Style Semi-Truck 55 mph Speed Limits and Right-Lane Restrictions on Interstates and Freeways May 16, 2026May 16, 2026
Vintage-style illustration of Babe Ruth, Lou Gehrig, and the 1927 New York Yankees at Yankee Stadium with the title “Murderers’ Row: How the 1927 New York Yankees Redefined Baseball Dominance.”
Murderers’ Row – How the 1927 New York Yankees Redefined Baseball Dominance May 7, 2026
Wide report title image showing a blue-and-gold biotechnology-themed Australian wheat field with realistic mice in the foreground, a glowing DNA helix, network graphics, and an outline map of Australia. Large title text reads: “Maximizer Strategy Report – Gene-Engineered Mice for the 2026 Australian Mouse Plague.”
Maximizer Strategy Report – Gene-Engineered Mice for the 2026 Australian Mouse Plague May 3, 2026May 3, 2026
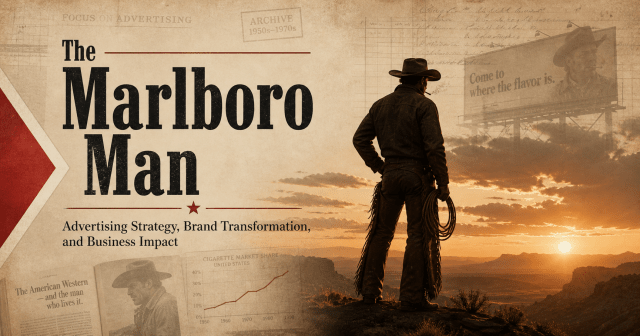
Vintage-style title image for a research report on “The Marlboro Man,” showing a silhouetted cowboy overlooking a Western desert sunset, with archival advertising textures, a faded billboard, market-share chart, and large editorial title text reading “The Marlboro Man: Advertising Strategy, Brand Transformation, and Business Impact.”
Philip Morris “Marlboro Man” Campaign: In-Depth Report May 3, 2026May 3, 2026
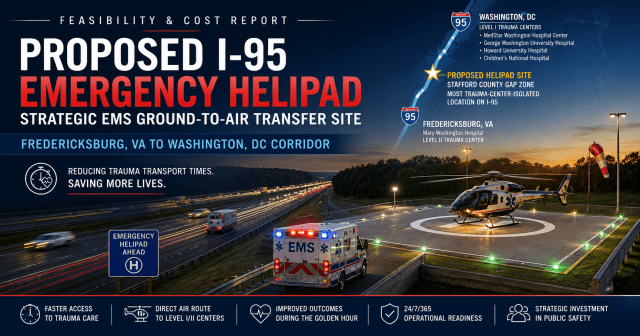
Title image for a strategic EMS infrastructure report depicting a highway-adjacent helicopter landing pad on I-95, with an ambulance transfer scene, nighttime lighting, and map indicators showing the corridor between Fredericksburg, Virginia and Washington, DC.
I-95 Corridor Emergency Helipad Feasibility Study May 3, 2026
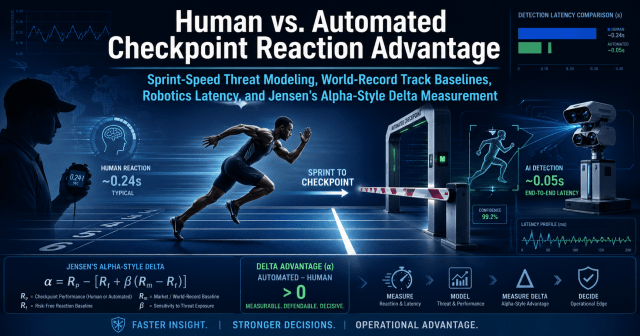
Wide, high-tech report cover titled “Human vs. Automated Checkpoint Reaction Advantage.” A sprinter races down a track toward a checkpoint gate while a human operator with a stopwatch is shown on the left and an automated AI camera/barrier system is shown on the right. Blue and green data overlays compare human reaction time of about 0.24 seconds with automated detection latency of about 0.05 seconds. The image includes charts, sensor targeting graphics, a Jensen’s Alpha-style formula, delta advantage notation, and a footer reading “Faster Insight. Stronger Decisions. Operational Advantage.
Human vs. Automated Checkpoint Reaction Advantage: Sprint-Speed Threat Modeling, World-Record Track Baselines, Robotics Latency, and Jensen’s Alpha-Style Delta Measurement April 26, 2026April 26, 2026

Posts navigation

Older posts
Newer posts

Search

Enter your email address to follow this blog and receive notifications of new posts by email.

Join 1 other subscriber
Powered by WordPress.com.
  • Subscribe Subscribed
    • Jarad Ponce
    • Already have a WordPress.com account? Log in now.
    • Jarad Ponce
    • Subscribe Subscribed
    • Sign up
    • Log in
    • Report this content
    • View site in Reader
    • Manage subscriptions
    • Collapse this bar
Loading Comments...